Adding tonnes of manure and compost to perennial pastures didn’t change soil carbon
By Patrick Francis
Over the last decade the Australian government spent millions of dollars funding the “Carbon Farming Futures-Action on the Ground” program. The Yarram Yarram Landcare Network in Victoria’s Gippsland was a successful recipient and conducted a producer/research demonstration project on 14 farms to “demonstrate and evaluate the effectiveness of different on-farm practices to increase the sequestration of carbon in soils”.
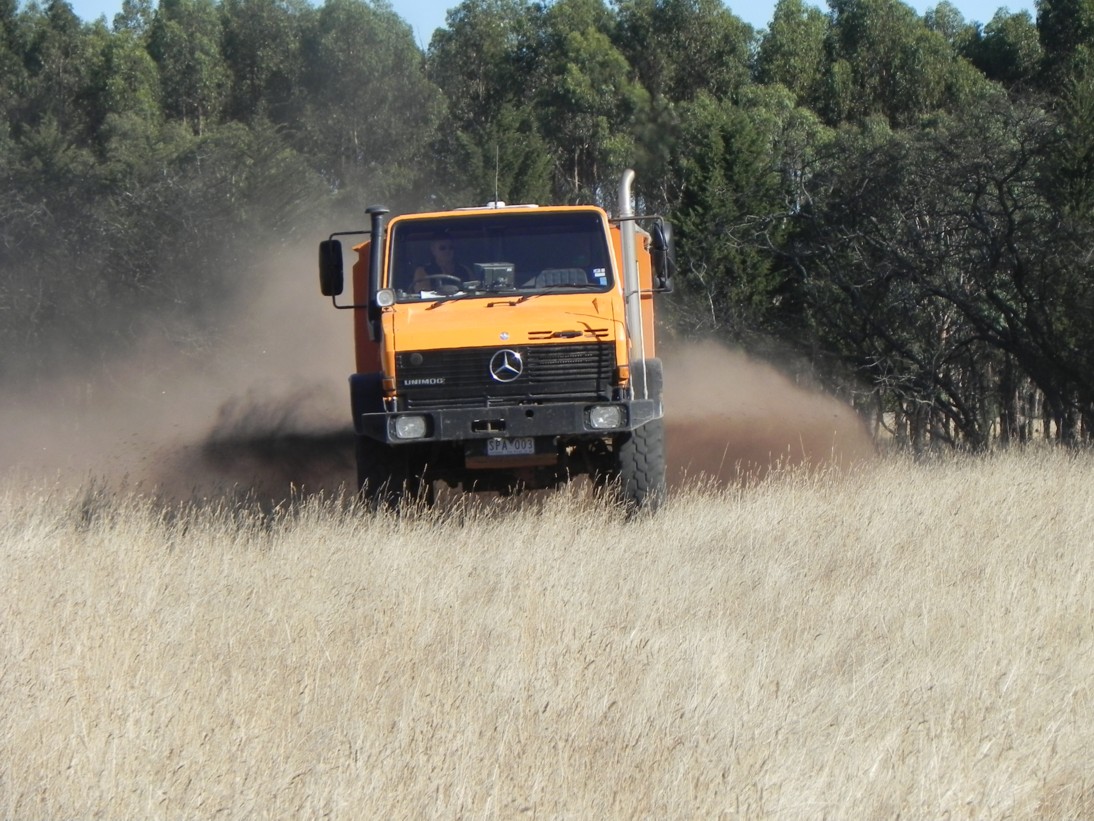
On-farm practices trialled included the use of drought tolerant perennial pastures, improved management of fertilisers, application of high rates of organic material (compost and chicken litter) and improved grazing/rotational management practices.
This demonstration has been exceptionally well documented and provides excellent indicative data for soil carbon sequestration on perennial pasture grazing farms in medium rainfall zones across southern Australia.
The technical report for the trial was written by agronomist Lisa Warn.
The Yarram Yarram Network soil carbon project on the Gippsland Plains in Eastern Victoria originated from the estimation by ClimateWorks Australia that there is potential for Gippsland’s pastures to increase soil carbon by 52,700 tonnes per year by increasing the use of deep rooted perennial grass species, increasing fertiliser use and improving grazing management. Another 18,000 tonnes per year of soil carbon could be sequestered by restoring productivity of less productive pastures across Gippsland.
When converted into CO2e abatement that’s a total of 258,762 tonne per year. If this could be captured in the government’s Emissions Reduction Fund agriculture methodology whose April 2021 auction average price was $15.99 per tonne CO2e (as Australian Carbon Credit Units), then the potential income generated across Gippsland is $3.88million per year.
The Yarram Yarram Network soil carbon project provides perennial pasture livestock farmers with some data to find out if significant CO2 abatement is realistic and subsequently if entering a contract to deliver Australian Carbon Credit Units is financially rewarding.
The project had two parts:
1: Maintaining and monitoring pasture trials established on 14 farms in 2009, and
2: Establishing three new trial sites to find out how application of organic material to perennial pasture impacted soil carbon level.
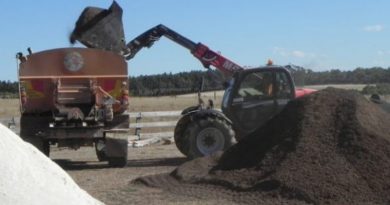
This review concentrates on the second component of the trial because it contains a suite of data on which to draw lessons about soil carbon sequestration. One farm had food and green waste compost applied to pastures and two farms had fresh (non-composted) chicken litter from meat chicken sheds applied for two years. Each farm had a ‘control’ paddock that received conventional inorganic fertiliser.
The analysis of the chicken litter and compost is shown in table 1.

Table 1: Nutrient analysis of chicken litter and compost used in the Yarram Landcare Network trial.
The compost and litter were applied at rates which gave similar amount of carbon per hectare to each paddock. These were high rates to deliver around 4 tonnes total carbon per hectare, table 2.

Table 2: Product application rates and total nutrients applied in the Yarram Landcare Network trial.
In doing his the amounts of nutrients applied in the treatments were much higher than farmers would apply annually as inorganic fertiliser. A nutrient comparison between superphosphate and compost and chicken litter is shown in table 3.
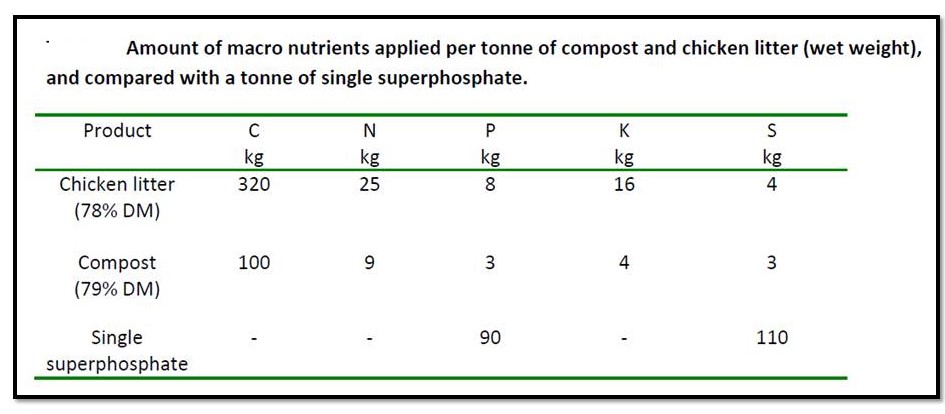
Table 3: Amount of macro nutrients applied per tonne of compost and chicken litter in the Yarram Landcare Network trial.
The important point to note in table three is that most farmers spreading superphosphate would do so at 100 – 200kg per ha to apply 9 – 18 kg P/ha/yr. With the compost applied at 26 t/ha and chicken litter at 14t/ha to achieve significant carbon input there is an enormous co-application of nutrients and in particular the leachable P and N. This has potential negative implications for ground water and surface water quality as a result of excess nutrient loads and was not mentioned in the report.
The cost of applying the 14t/ha chicken litter and 26t/ha compost are shown in table 4 based on cost of carbon applied per tonne and cost per ha. At the soil carbon target application rates the costs of both organic compounds are extremely high and would require significant ecosystem functions and productivity benefits to justify.
Warn commented that the chicken litter would have to be approximately one third of its price delivered and spread and the compost one quarter of its price to supply a key nutrient like P at a similar cost of superphosphate.

Table 4: Cost of fertilisers used in the Yarram Landcare Network trial.
An interesting outcome of the trial was the impact of the various treatments on soil nutrient levels. As tables 1 and 2 show the chicken litter at the rate applied provides the soil and therefore plants with a high input of a smorgasbord of nutrients. For instance 112kg P per hectare. This is a much higher rate than most farmers would apply with superphosphate, where rates are generally between 9 and 18kg P per hectare based on the requirement for maintenance or capital applications. Similarly the amounts of K added per hectare in the litter was exceptionally high at 224kg. The impact was an increase in soil nutrient especially on the chicken litter paddocks, table 5.
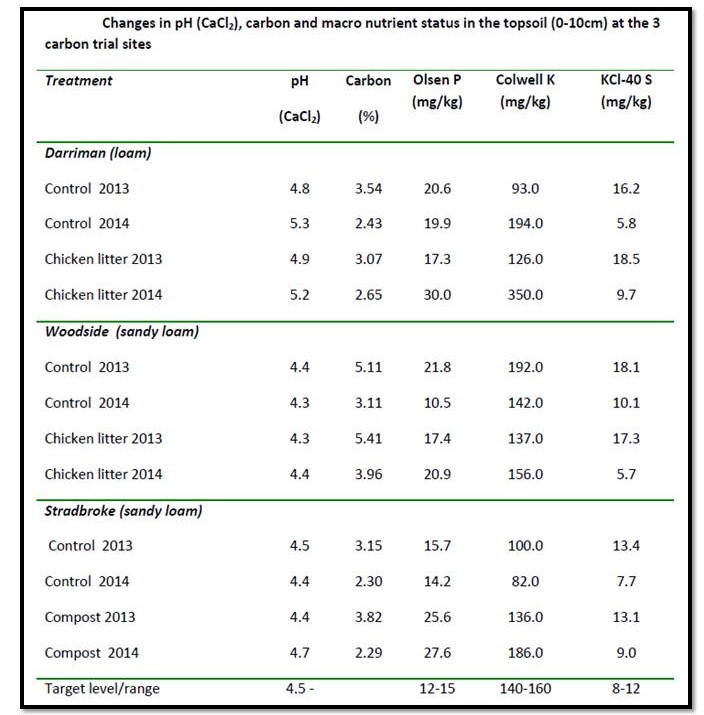
Table 5: How soil nutrient levels changed as a result of adding chicken litter and compost in the Yarram Landcare Network trial.
The impact of the chicken litter applied at 14tonnes per ha was particularly evident on the Darriman paddock where Olsen P nearly doubled and is in excess of maximum recommended level of 24mg/kg. Warn’s table suggests a target Olsen P of 12 – 15mg/kg. The Colwel K level in the Darriman paddock is double the recommended level. It is interesting that in the Sandy Woodside paddock the impact on soil nutrient levels of 14 tonnes per ha of chicken litter was far less than on the loam Darriman paddock. The question is what happened to the nutrients in the soil on the Darriman paddock?
Soil carbon stock results
The point of the trial was to find out if adding organic materials with high carbon content and nutrients would impact soil carbon stocks. Soil organic carbon stocks were measured in the control and treatment paddocks in 2012 and again in 2014, table 6.
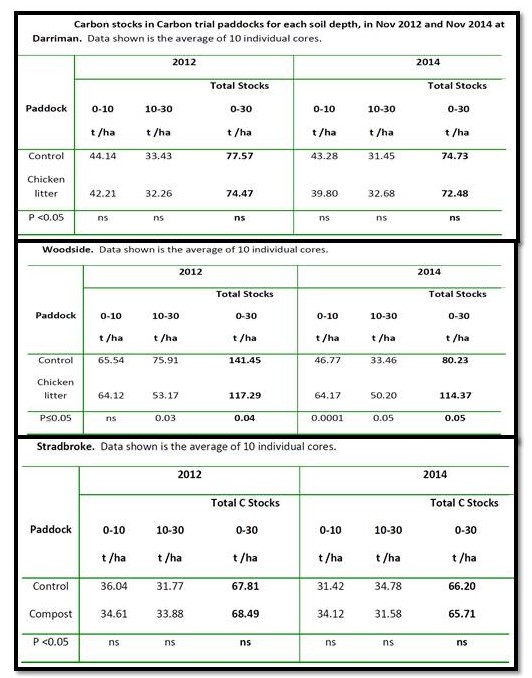
Table 6: Changes is soil carbon stocks at the three sites comparing controls (inorganic fertiliser only) with addition of 14tonnes/ha chicken litter and 26tonnes/ha compost in the Yarram Landcare Network trial.
At Darriman soil carbon stocks remained static for both the control paddocks and the chicken litter paddock which had 14 tonnes of chicken litter (4tonnes/ha carbon) applied.
The Woodside control paddock result should be treated with suspicion as the 10 – 30cm carbon stock result in 2012 is anomalous. The Woodside chicken litter paddock stocks showed a similar change as Darriman, decreasing despite the addition of 14tonnes of chicken litter.
At the Stradbroke site soil carbon stocks remained static for both the control and compost paddocks from 2012 to 2014. Application of 26tonnes/ha of compost (3tonnes/ha carbon) did not increase soil carbon stocks. .
Given four and three tonnes of carbon were added per hectare to the soil with chicken litter and compost respectively in 2013 and 2014 the question is what happened to the SOC?
NSW DPI soil scientist Dr Susan Orgill in an April 2021 webinar provides a possible answer, it is decomposed by plants and soil microorganisms with CO2 being returned to the atmosphere. Otherwise it could have been lost via soil erosion, but the given the pastures were covered with perennial pastures this is unlikely and there is no suggestion from the report author that erosion took place. If respiration is the fate of extra organic matter added at the two sites it raises the possibility that the sites were at a SOC equilibrium prior to the application of chicken litter and compost.
It is also important to understand what type of SOC is being added to soil with chicken litter, compost and increased pasture growth. Virtually all this is labile carbon which is easily decomposed by microorganisms with CO2 being returned to the atmosphere. Very few trials measure the different types of SOC being sequestered by changed management practices.
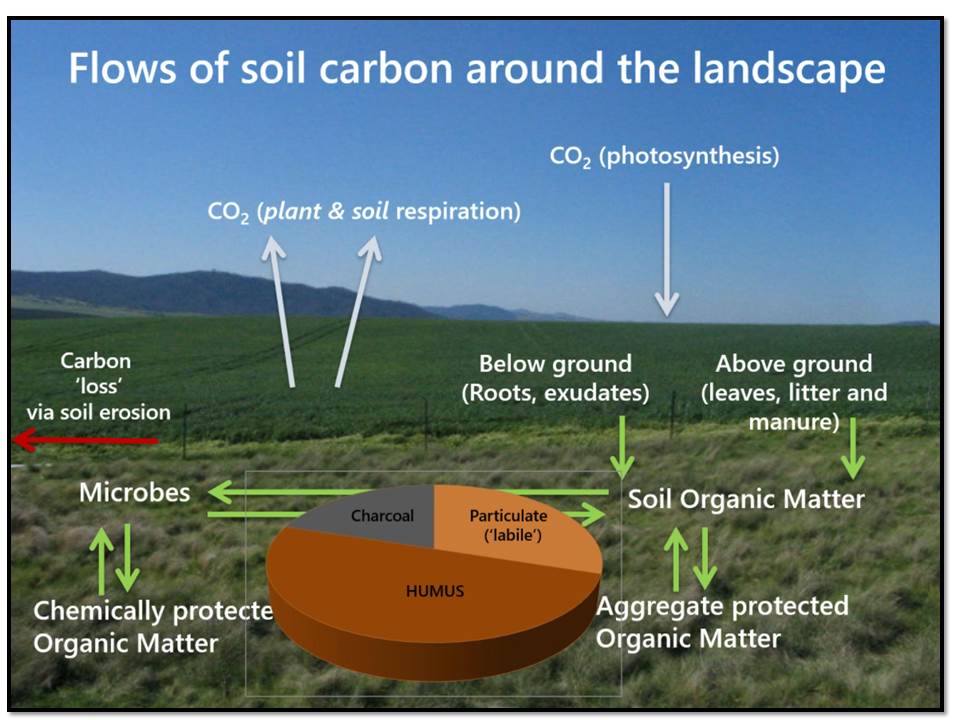
Figure 1: Carbon flows in agricultural landscapes. Source: Dr Susan Orgill NSW DPI webinar April 2021.
In contrast to soil carbon percentage decline the P and K levels at the chicken litter and composts sites all received a boost, not surprising given the nutrients applied in each product (table 2). There was one exception, that was with sulphur (S). The results show this element declining at each inorganic treatment site despite high levels contained in the products.
The P, K and S results in the control sites between 2013 and 2014 were far from anticipated. These sites had superphosphate and potash applied at rates considered necessary to maintain or boost levels. At Woodside both nutrients declined to marginal levels and K at the Stradbroke site dropped well below desirable level. At all control sites S level dropped despite superphosphate contain S.
These results highlight the issue of how to interpret soil test results and more importantly what fertiliser decisions should be made based on them?
A better indicator for fertiliser decision is likely to be the vigour and recovery of pasture species in a paddock and livestock carrying capacity trends over at least five years. Given amount of rainfall and timing of rainfall is highly variable, short term soil test data may not always reflect paddock carrying capacities. The data might simply reflect natural variation in nutrient levels as impacted by changes in soil biology respiration rate as it is impacted by seasonal rainfall and temperatures.
Paddock carrying capacity results
Another clue to the soil at the sites being at SOC equilibrium can be found in the different pasture response measured by livestock carrying capacity at the three sites. Increased livestock carrying capacity (dry sheep equivalents (DSE) per hectare) in response to increased pasture growth as a consequence of adding organic or inorganic nutrients and rotational grazing supporting greater soil biomass, is recognised as a primary method for increasing soil organic carbon in the Emissions Reduction Fund agricultural soil carbon methodology (figure 7) as well as across best practice livestock grazing management programs.
But the methodology does not distinguish the types of SOC being increased – is it mostly labile carbon or is there a significant component of humic SOC. If the latter, long-term SOC increase is possible but the percentage involved is small and statistical relevant measurement of humic SOC is extremely difficult. Total SOC measurement “noise” even with the large editions of labile carbon is high.
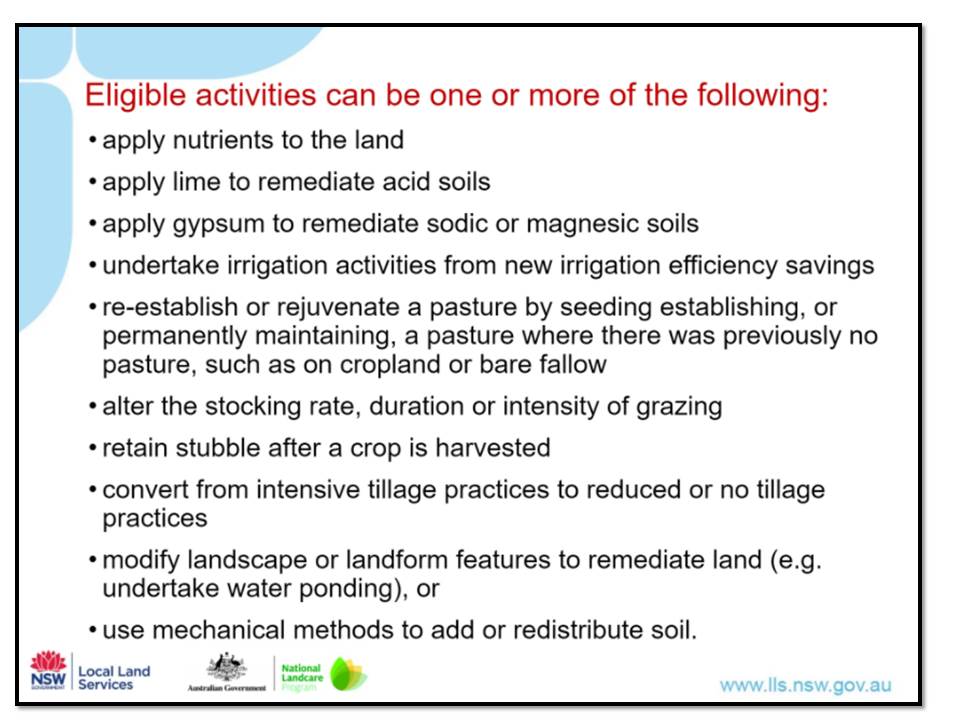
Figure 2: Emission Reduction Fund agricultural methodology eligible activities for increasing soil carbon. It doesn’t distinguish between labile SOC and humic SOC. It does not allow addition of charcoal SOC through the application of biochar. Source: Luke Signor, assistant manager savanna, agriculture and soil carbon credits team, Australian Government, April 2021.
In this trial the author reports increased livestock carrying capacity on the chicken litter sites but not the compost site compared with the control sites as a consequence of increased pasture growth, table 7.
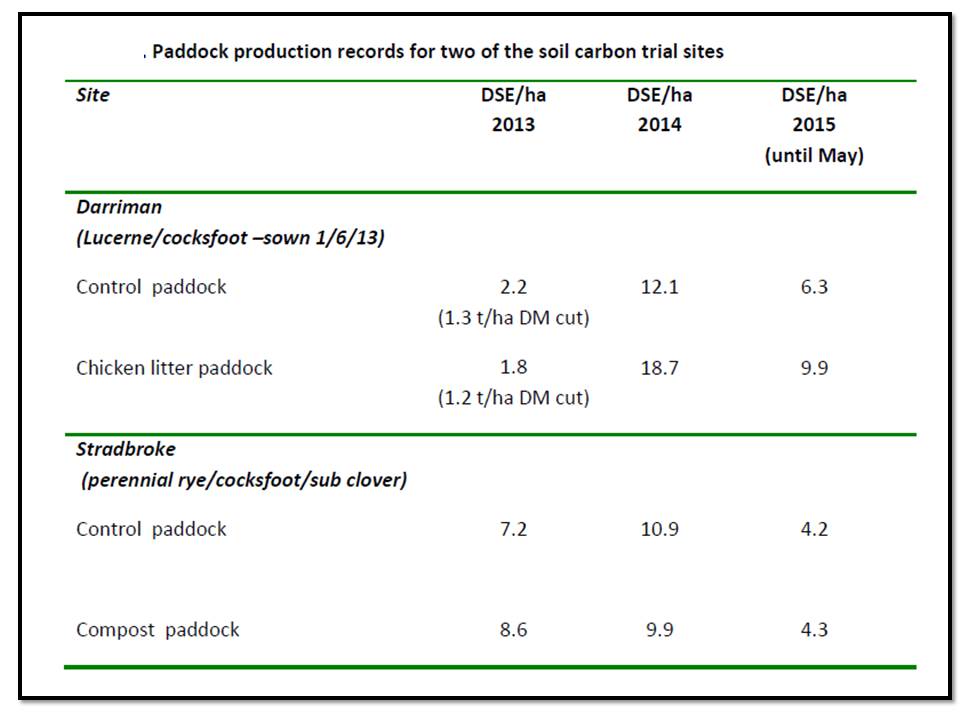
Table 7: How livestock carrying capacities at one chicken litter site and the compost site changed compared to the control sites in the Yarram Landcare Network trial.
“The chicken litter produced an obvious visual response in pasture growth at Darriman and Woodside, which was evident in winter soon after the autumn application of litter. The increase in pasture growth was most likely due to a nitrogen response as all other macronutrients were not limiting at both sites. The stock numbers (DSE/ha) carried on the chicken litter treated paddock was around 60% higher than the Control paddock in 2014 and 2015, and most importantly, additional carrying capacity was achieved through the winter,” she said.
The extra pasture growth achieved on the chicken litter sites would be expected to add SOC unless the additional organic matter was lost through respiration. As there was no increase in SOC at chicken litter sites by November 2014, it seems any additions through this pathway were lost to respiration, i
“These results indicate that 4 tonnes/ha of carbon added in chicken litter etc is not enough to give a significant change in soil carbon stocks. 50-70% of the 4 t C/ha might be lost in respiration – so doesn’t leave much C. If you look at the total carbon stocks we started with on the demo sites 70-100 t C/ha – adding an extra 2 t C/ha is not likely to be make a significant difference . You need lots of organic matter over many years to be added to soil to make a difference,” Warn said.
Another chicken litter trial
Lisa Warn conducted her own trial for RIRDC in 2009 -2012 examining chicken litter impact on soil organic carbon levels. This was undertaken at Glenaroua (near Pyalong) and Pastoria (near Kyneton) in central Victoria on two permanent pasture sites. Table 8 show the soil analysis at the start of the trial and the nutrients added with inorganic fertiliser and the carbon added with the chicken litter.
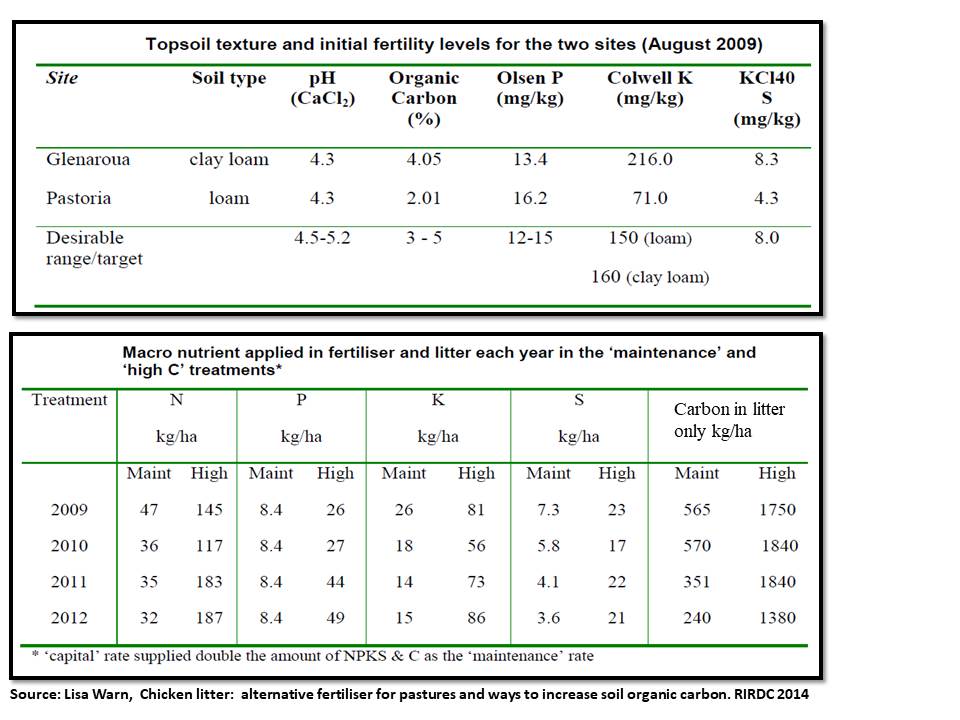
Table 7: In the Central Victorian trials chicken litter was compared with a range of inorganic fertilisers applied to perennial pastures over four years.
At the highest chicken litter application rates over four years – 20 tonnes/ha, SOC was increased (slightly) at Glenaroua site but not at the Pastoria site compared with the controls, but the differences were not significant, figure 3. “The results highlights how even putting on 20t/ha chicken litter (about 8tonnes C/ha) isn’t enough to push the soil C up enough to be significant /measurable. But you can see there is a positive trend with the higher rates of litter. Just need more tonnes/ha and more time,” Warn said.
The increase in SOC at Glenaroua is somewhat surprising as its original level was above 4%. Many trials and anecdotal evidence suggest SOC increases are most likely if SOC is below 2% and unlikely in soils above 4%. The opposite was the case in this trial.
“Soil texture is the key here. The Glenaroua site had a heavier soil type -clay loam (more clay content capable of retaining more carbon) compared with Pastoria -a granitic loam – hence the lower initial C content,” Warn commented.
Warn notes this in reference to using management strategies for SOC trading revenue stating “ if the soil carbon levels are already moderate to high (>3%) as they commonly are in many pasture soils in the higher rainfall areas, the soil stores may already be saturated with carbon.”

Figure 3. In the Central Victorian trials, chicken litter versus inorganic fertiliser, carbon stock to 30cm depth were not significantly changed after four years of applications.
Analysis of what type of SOC increased showed that only particulate organic carbon increased while humus organic carbon remained static. Particulate organic carbon is the short lived or labile component and will vary seasonally influenced by rainfall and temperature. The Emission Reduction Fund soil carbon methodology and private soil carbon markets don’t differentiate what types of carbon comprise increases achieved through changed management practices outlined in figure 2. But if the increase is due to labile carbon and this is subject short term impacts such as rainfall and temperature then trading on the assumption that the measured SOC is permanent may have significant risk.
Add to that risk the likelihood that an initial boost to SOC from undertaking changed management practice such as annual applications or inorganic fertiliser like chicken manure usually levels out to an equilibrium within a few years then the farmer’s responsibility to retain the original gain may become a financial liability without significant annual productivity benefits such as increased livestock carrying capacity per hectare.
Liquid carbon pathway
Some advocates of soil carbon trading following management interventions as outlined in figure 2 contend that even if measured SOC in the top 10cm of soil is in equilibrium there is another pathway which contributes to increased soil carbon at a greater depth, the liquid carbon pathway. This pathway is promoted by some regenerative agriculture champions who contend it often goes unrecognised in conventional farming grazing and fertiliser trials because the SOC change below 30cm is not being measured.
The liquid carbon pathway involves mycorrhizal fungi developing a symbiotic relationship with live plant roots. Dr Christine Jones described the pathway in an Australian Farm Journal article in July 2008. “Mycorrhizal fungi differ quite significantly from decomposer fungi in that they acquire their energy in a liquid form, as soluble carbon directly from actively growing plants. … Mycorrhizal fungi access and transport water – plus nutrients such as phosphorus, nitrogen and zinc – in exchange for carbon from their living host. They also have the capacity to connect individual plants below ground and can facilitate the transfer of nutrients between species.
“Under appropriate conditions, a large proportion of the soluble carbon channelled into aggregates via the hyphae of mycorrhizal fungi undergoes humification, a process in which simple sugars are resynthesised into highly complex carbon polymers. Humus polymers are made up of carbon and nitrogen from the atmosphere, combined with a range of minerals from the soil. These organo-mineral complexes form a stable and inseparable part of the soil matrix that can remain intact for hundreds of years. Humified carbon differs physically, chemically and biologically from the labile pool of organic carbon that typically forms near the soil surface. Labile carbon arises principally from biomass inputs (such as crop residues) which are readily decomposed. Conversely, most humified carbon derives from direct exudation or transfer of soluble carbon from plant roots to mycorrhizal fungi and other symbiotic or associative microflora. It is ‘microbial carbon’ as opposed to ‘plant carbon’.
“Humus can form relatively deep in the soil profile, provided plants are managed in ways that encourage vigorous roots. Once atmospheric carbon dioxide is sequestered as humus it has high resistance to microbial and oxidative decomposition. The soil conditions required for humification are diminished in the presence of herbicides, fungicides, pesticides, phosphatic and nitrogenous fertilisers – and enhanced in the presence of root exudates and humic substances such as those derived from compost,” Jones wrote.
Given that in the Yarram Yarram trial which included a high rate of compost application and didn’t see an increase in SOC and the Central Victorian trials which didn’t achieve an increase in humic carbon after four years of litter applications, then the liquid carbon pathway does not seem to be operating despite both sites involved perennial pastures.
There could be a range of reasons for this such as:
* SOC was not measured at sufficient depth, greater than 30cm down the soil profile
* Previous management of the sites particularly the use of herbicides and inorganic fertilisers had negatively impacted the amount of mycorrhizal fungi in the soil (lowering the fungi to bacteria ratio).
* Grazing management of the perennial grasses present and lack of species diversity was inappropriate for achieving root growth to depth. The Central Victorian trials did not involve grazing, plots were cut to measure productivity.so had long rests between harvests & were not cut low.
Jones contends that “Under appropriate conditions, 30-40% of the carbon fixed in green leaves can be transferred to soil and rapidly humified, resulting in rates of soil carbon sequestration in the order of 5-20 tonnes of CO2 per hectare per year.”
Regenerative Agriculture champion and grazing management consultant Terry McCosker told the March 2021 Crawford Fund workshop “What can farmers do – Farmer led, Science based greenhouse gas mitigation” that the liquid carbon pathway is responsible for “new soil carbon” if management allows a high fungus to bacteria ratio to be achieved. He gave the example of one farm near Dubbo lifting SOC from 0.7% to 3.7% in the top 10cm in just 2.5 years, that’s an estimated 9.6tonnes carbon added per ha per year. The paddock involved irrigated corn and dual purpose wheat or oats rotationally grazed with cattle at up to 37dse/ha for six months per annum.
What doesn’t align with Jones version of the liquid carbon pathway in this example is the fact that SOC increase is up to 95% labile carbon which is likely to be lost in a few years if the farming methodology using multi-species cropping, fertilisers and rotational grazing stops. As well, the example has no control paddock to compare to, so takes no account of how SOC varies between seasons and year to year depending on amount and seasonality of rainfall.
“Models designed to mathematically predict the movement of carbon in and out of soils are generally based on the assumption that carbon enters soil as ‘biomass inputs’, that is, from the decomposition of leaves, roots and crop stubbles. … While plant residues are important for soil food-web function, reduced evaporative demand and the buffering of soil temperatures, they do not necessarily lead to increased levels of stable soil carbon,” Jones writes.
Take home message
While anecdotal evidence may exist in particular farmer’s paddocks that SOC can be quickly increased over a short number of years, scientific trials demonstrate a much slower increase with the rate dependent on the level of SOC loss and the amount of organic matter input from herbage stimulated by organic and inorganic fertilisers. The two trials described show that soil health, ecosystem functions, pasture productivity and paddock livestock carrying capacity are all connected but are not necessarily improved with organic and inorganic fertilisers.
Monitoring the entire grazing systems is likely to be more rewarding for profitability and environmental improvement than chasing dynamic soil organic carbon increases. In other words managing crops and pasture for carbon flows is more rewarding than managing for carbon stocks. The results demonstrate the incredible complexity of biological systems such as livestock grazing pastures and the challenge to achieve measurable stock increases over 25 to 100 years as required in the soil carbon methodology.
References:
“Gippsland Plains Soil Carbon Trials – productivity and climate change responses, Technical Report” by Lisa Warn. Yarram Yarram landcare network, June 2015.
“Chicken litter: alternative fertiliser for pastures and ways to increase soil organic carbon” by Lisa Warn, Rural Industries Research & Development Corporation, September 2014. Publication No 14/087
“Liquid carbon pathway” by Christine Jones, Australian Farm Journal July 2008.