Pasture trials with lime plus organic and inorganic fertilisers
Introduction by Patrick Francis
The information presented in this paper is important for pasture farmers looking for scientific data which may help make decisions on lime applications. My take home message from this review is that farmers should be monitoring soil test data in paddocks across their farms to understand nutrient and soil acidity trends occurring. But more importantly they should be monitoring paddock carrying capacity per hectare and per 100 mm of rainfall on a continual basis to provide the most accurate assessment of the complex interactions taking place between soil nutrient status, pasture species, soil biology, and grazing methodology. The data in this report highlight how managing for optimum soil test results can be unrewarding in terms of pasture growth response. This is demonstrated by the number of sites in which the pasture growth in control plots (no fertiliser or no lime application) was similar to and sometimes higher than treated plots.
This does not mean fertilisers, wether organic or inorganic and soil ameliorants like lime, should not be applied to meet recommended nutrient and pH levels, but suggests a suite of factors need to be considered in making the decision about inputs. Input applications are best made based on soil test data in conjunction with paddock carrying capacity trends and paddock nutrient budgets. In paddocks with a moderate soil nutrient content, pHCa above 5, soil organic carbon above 3%, perennial pasture species content above 65%, where no silage or hay is cut, and stocking rate matches carrying capacity throughout the year, then nutrient export in livestock products per year is small. In these paddocks annual replacement of nutrients may not be necessary and even if applied may not produce a discernible pasture growth response. On the other hand, nutrients will need replacing from time to time based on nutrient budgeting and objectives for paddock carrying capacity.
Under such paddock conditions farmers would be wise to conduct their own nutrient and soil ameliorant trials before making blanket applications of products. Remember applying nutrients and ameliorants to grow more pasture per hectare is only of value to a livestock business if it economically contributes to increased output of livestock product per hectare as well as improving ecosystem functions across the paddock and the farm.
Trial results
By Lisa Miller, agronomist Southern Farming Systems (SFS)
Key messages
- Soil tests help to identify what is constraining production and what products will best address it
- Production responses could generally be attributed to the nutrients contained within the biological products
- Pasture production losses from acidity reached as high as 886 kg DM/ha over the 2015 growing season
- Lime responses in pastures were constrained by nutrient deficiencies and fertiliser responses were constrained by acidification
Background
The Corangamite Catchment Management Authority (CCMA) through support by the Department of Agriculture, Forestry and Fisheries (DAFF) have funded SFS to work with Landcare networks for four years to trial lime and organic fertilisers across the catchment. The purpose of the work is to create a body of evidence that farmers can tap into when making decisions about where and when to use organic products by the collection of pasture and crop dry matter yield responses. There are currently 17 pasture sites testing the using organic fertilisers or biological stimulants and lime.
Method
The majority of trials were set up by SFS in 2014 with host farmers and Landcare networks who selected products they wanted to test. Six sites (three pasture and three crop) were established in 2012 by the Woady Yaloak catchment group and involve testing of biological stimulants. Another two (one pasture and one crop) are alternative fertiliser trials that were originally established in 2009 which SFS took over the monitoring of in 2014. SFS are also monitoring a Moriac lime trial that the Surfcoast Inland Plains Network started in 2012. All of the trials also involve testing lime responses. Soil pH results reported in this paper use the calcium chloride test which is approximately 0.7 units lower than the water method due to its consistency across seasons.
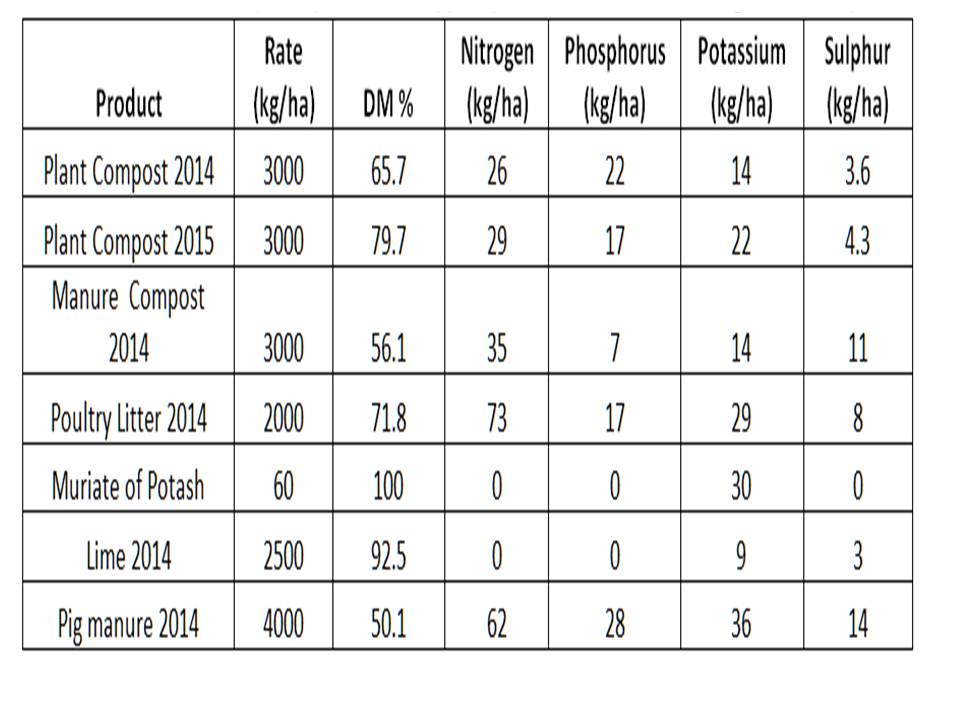
A comparison of nutrients applied using different products is shown in table A. In 2015 products were applied mainly in autumn unless otherwise specified and lime rates were surface applied at the start of each trial.
Table A. The rate and total quantity of nutrients applied per hectare of different biological and lime products.
Dry matter (DM) yields are monitored by cutting strips (approximately 1.4 m x 12 m) off the plots up to five times per year using a forage harvester. All pasture sites are fenced off and monitored from May until November and then opened up for stock grazing. The Moriac and Simpson site are not fenced off and contained within an existing paddock so that all the treatments will also include any farmer’s fertiliser applications.
Animal manures
A number of animal manures were applied to sites in 2013 or 2014 but not in 2015 to see the carry over effect of application. Although there had been significant responses in 2014 (Meredith, Freshwater Creek and Linton) which were reported in SFS trial results booklet 2014, they were short lived as no responses have been carried through into 2015. Most likely the initial responses were due to the supply of nitrogen.
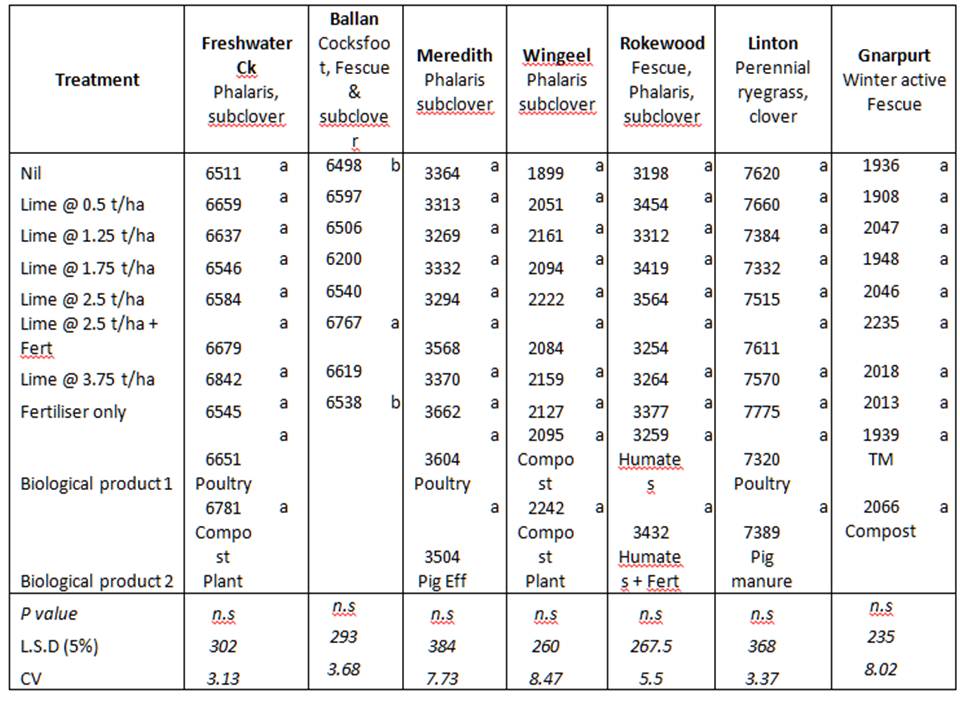
Table 1. Total mean cumulative pasture yields (kg DM/ha) for 2015 at different pasture lime and biological trials in rainfall areas above 600 mm.
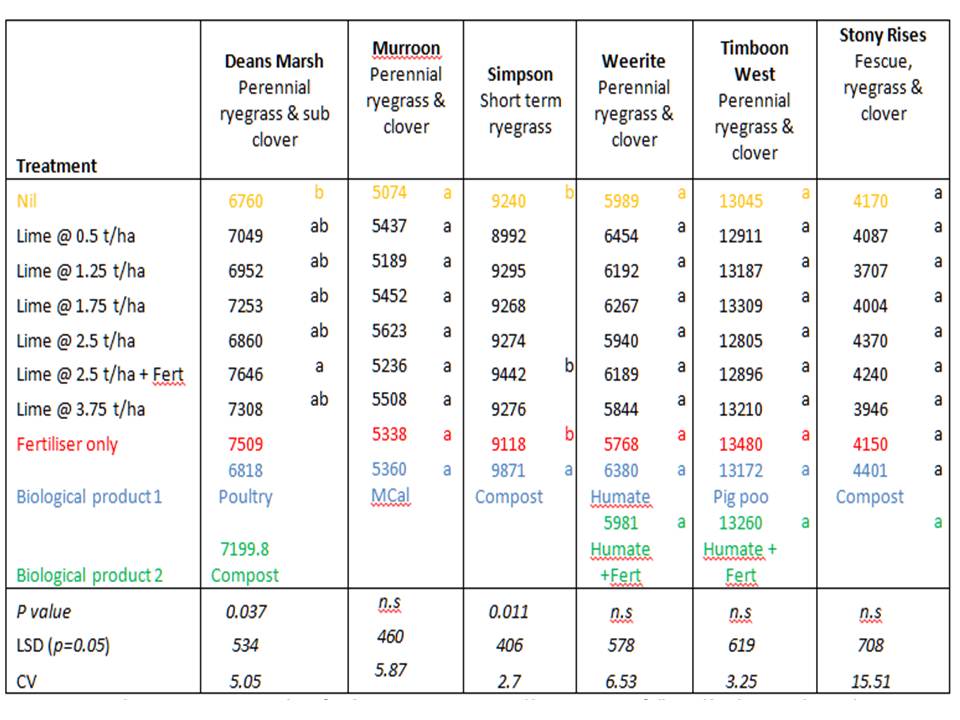
Note the statistics presented are for the treatments assigned letters. Means followed by the same letter do not significantly differ.
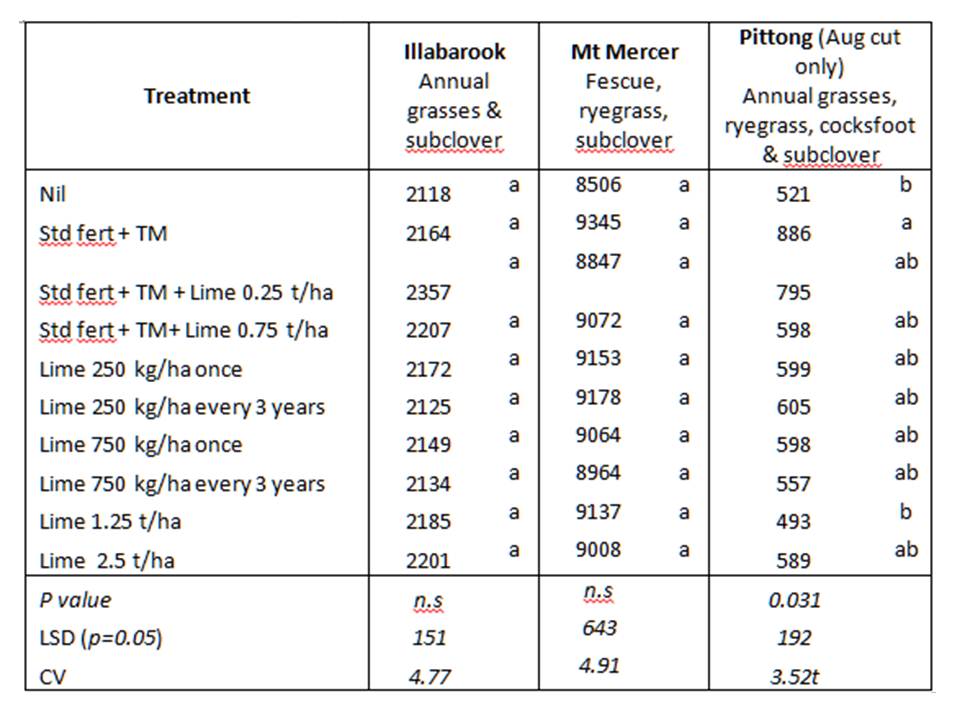
Table 2. Total mean pasture yields (kg DM/ha) for 2015 at different pasture lime and biological trials in rainfall areas less than 600 mm.
Note the statistics presented are for the treatments assigned letters. Means followed by the same letter do not significantly differ.
Composts
There were two different types of compost used, one based on animal manures and one made from plant green waste. Nutrients from these different composts are shown in table 1 with composted animal manures generally containing higher nutrient levels. Seven trials included compost and the Simpson and Freshwater creek sites showed significant responses.
Only the Simpson site showed a significant cumulative dry matter response to compost 3 t/ha growing an extra 631 kg/DM/ha compared to the Nil treatment. The compost was applied in 2014 and 2015. Individual cuts in August (p=0.002) and October (p=0.03) were significantly different to the nil treatment but not in May, July or November. This response may be from nitrogen contained in the compost equivalent to approximately 29 kg N/ha.
Plant based compost was used in the Freshwater creek trial. It produced a significant increase of 190 kg DM/ha versus the Nil and fertiliser treatment in May (p=0.025). The Deans Marsh site also had a statistical significant response in August of 217 kg DM/ha (p= 0.0061). Sizeable increases in mean dry matter occurred at the other sites from compost but statistical significance was not achieved.
Biological stimulants
The biological stimulant used in the trials (TM) allows for a reduction in the use of inorganic fertilisers. Responses are claimed to occur two to three years after application. Rates were applied in May and August in pastures. The Woady Yaloak catchment group followed up testing of TM in 2012 after success in one of three trial sites in their testing of alternative fertilisers in 2009 to 2010 which included Cape Clear (crop) and Mannibadar (pasture).
TM appears to show some promise on low fertility soils. There was a significant response at Mannibadar with an extra 684 kg DM/ha with TM and a half rate of fertiliser (see table 4). This site had an Olsen P of 6.3 mg/kg in 2011. The Pittong site showed significant difference at the August cut only with an extra 365 kg DM/ha produced above the Nil treatment. This site was deficient in potash and sulphate of potash 100 kg/ha was applied to all plots in 2015. No responses have occurred at the Gnarpurt site which was high in P (Olsen P = 20.6 mg/kg) or Mt Mercer (Olsen P = 11.2 mg/kg).
Table 3. Total mean cumulative pasture yields (kg DM/ha) for 2015 at different trial sites established by the Woady Yaloak Catchment group in 2012.
Note the statistics presented are for the treatments assigned letters. Means followed by the same letter do not significantly differ.
Table 4. Total mean cumulative pasture yields (kg DM/ha) for June, September start and end 2015 at Mannibadar
|
Treatment |
Yield (kg DM/ha) |
|
| Nil |
3498 |
b |
| Super @ 125 kg/ha |
3862 |
ab |
| Chook manure applied 2014 |
3915 |
ab |
| Seasol & Powerfeed |
3676 |
ab |
| Wormcastings + Lime |
3714 |
ab |
| Lime 750 kg/ha in 2013 |
4150 |
a |
| TM + Super 62.5 kg/ha |
4182 |
a |
| Nutrisol |
4108 |
ab |
| P value |
0.019 |
|
| LSD (p=0.05) |
410 |
|
| CV |
7.2 |
|
Soil conditioners
Humates were applied at three sites. Humates contain 60% humic acid which is also found in humus. Humus is a relatively stable form of organic carbon. Humates are hoped to increase the nutrient (cation and anion exchange capacity) and water holding capacity of the soil so that structural characteristics including water infiltration, water holding, aeration and workability is improved. There has been no significant response in pasture yields to the use of humates to date. Most of the sites where humates were used contain greater than 2% organic carbon and so possibly carbon may not be constraining production. In comparison to other products it does not contain nutrients to give a fast response but has the potential to improve nutrient availability through decreasing leaching.
Liquid Biological fertilisers
MCal is a liquid calcium product that was applied at the Murroon site. It increased yield above that of the Nil treatment but it was not statistical significant and so we cannot be confident this increase was from the product and not by chance. To get a response to calcium the site would need to be deficient in it. Deficiencies of calcium in Australian soils are not common (Price 2006). The soil tested 5.07 meq/100g for exchangeable calcium. The level where calcium is considered marginal or deficient is below 1 meq/100 g (NSW DPI). This site did show a significant potassium response in 2014 and so every plot received potassium to remove this as a constraint.
No statistically significant yield responses were achieved using Seasol and Powerfeed or Nutrisol in 2015 compared to the Nil treatment despite increases in cumulative mean dry matter. See Nicholson 2010 for further information in relation to these products and their responses.
Table 5. Total mean cumulative pasture yields (kg DM/ha) for June, August, October and November 2015 at Moriac
| Treatment | Yield (kg DM/ha) | |
| Nil |
5365 |
ab |
| Lime 3 t/ha |
4845 |
b |
| Lime 3 t/ha + compost |
4952 |
ab |
| Lime 3t/ha + potash |
4844 |
b |
| Lime 3 t/ha + compost & potash |
5246 |
ab |
| Lime 1.5 t/ha |
5369 |
ab |
| Lime 1.5 t/ha + compost |
5440 |
ab |
| Lime 1.5 t/ha + potash |
5335 |
ab |
| Lime 1.5 t/ha + potash+ compost |
5607 |
a |
| Compost |
5441 |
ab |
| P value |
0.0168 |
|
| LSD (p=0.1) |
384 |
|
| CV |
6.1 |
|
Lime production responses
Two sites (Deans Marsh and Ballan) showed significant responses to Lime 2.5 t/ha with fertiliser indicating that the lime responses are being held back by nutrient deficiencies and fertiliser responses are being constrained by acidity. The yield responses are mainly from increases in the availability of nutrients by increasing access to plant nutrients by removing aluminium toxicity rather than making more phosphorous become available in the soil from unlocking it from fixed complexes with aluminium or iron (NSW DPI). Lime alone is not a substitute for phosphorus fertiliser but as seen by the evidence below, lime complements fertilisers and adds to their effectiveness.
The Deans Marsh site contains high acidity with pHCa of 4.5 being recorded at both 0-10 and 10-20 cm soil depths and 4.6 at 20-30 cm. As a result exchangeable aluminium levels were high at 8%, 20% and 19% respectively at each depth which would restrict the plant’s roots to access nutrients and moisture. Soil nutrients were also less than critical values to maintain 95% of potential pasture production particularly phosphorus (Olsen P = 7.3 mg/kg) and potassium (Cowell K = 80 mg/kg). Only the Lime 2.5 t/ha plus Fertiliser (Super Potash 300 kg/ha) rate gave significant production responses for total dry matter collected over four cutting periods of 886 kg DM/ha compared to the Nil treatment. It also produced significantly more pasture at the cutting times of August and October but not May or November which could have been due to moisture stress.
The Ballan site also showed a response of Lime 2.5 t/ha plus muriate of potash 60 kg/ha with a total dry matter increase of 269 kg/ha compared to Nil and higher than the Fertiliser or just Lime treatment. This treatment was significant in the October cut (p= 0.013) producing an extra 144 kg DM/ha above Nil at the 90% confidence level. Potassium (K) was very low at this site with a Cowell K of 103 mg/kg. Critical values of potassium for achieving 95% of potential pasture production in a clay loam is approximately 160 mg/kg.
The Mt Mercer site showed no significant response over the cumulative total DM from five cuts but did show a significant lime response to all rates of lime (increase of 161 to 330 kg DM/ha) in September (p=0.006, CV 6.55) and in November (p=0.009, CV 3.42) at lime rates 2.5 t/ha (increase 256 kg DM/ha) and Lime 250 kg/ha which is applied every 3 years (increase 339.8 kg DM/ha). The site when tested in 2015 had 1.2% Aluminium and pH 4.9. This site was also deficient in potassium (Cowell K = 95 mg/kg) and could have been restricting responses and sulphate of potash was applied to all treatments excluding the Nil treatment in 2015.
The Mannibadar alternative fertiliser site also showed a significant cumulative DM response of 652 kg DM/ha to the lime treatment of 750 kg/ha which was applied in 2013 (see table 4). It was also significant in the late September cut with an extra 280 kg DM/ha (p=0.021) produced.
Its possible responses at the Mt Mercer and Mannibadar site may have come from increased mineralisation of organic matter resulting in more nutrient availability from lime improving micro-organism activity. Alternatively it may have increased the availability of Molybdenum which in turn has improved nitrogen fixation of clovers as rhizobia strains which inhabit subclover become affected at pH levels less than 5.0.
Sites where lime responses notably did not occur was at Simpson and Pittong. This was because acidity within the surface soil (0-10 cm) was not constraining production with pH levels at 4.5 and 5.1 with low aluminium content of 2.4% and 2%. However there is subsurface and subsoil acidity which has not yet been affected by the surface liming. At the 10-20 cm soil layer pH declined to 4.2 and 4.6 and aluminium increased to 31% and 17% respectively. Further increases in aluminium occurred in the 20 to 30 cm soil layer. Although lime was applied at the Pittong site in 2012 it was found to be still confined to the top 10 cm at the Pittong site after three years. Other sites with low aluminium (< 5%) in their topsoil but high aluminium at depth were Murroon and Meredith.
Most of the other sites did not show significant responses to lime because aluminium toxicity issues were less than 5% (Wingeel, Weerite, Stonyford, Murroon, Meredith, Freshwater Creek, Gnarpurt, Linton, Illabarook) in the top 10 cm and or the pasture species present where tolerant to aluminium. Exceptions to this were both Rokewood and Moriac which had Al% of 5.6% and neither showed cumulative significant lime responses compared to the Nil treatment but Rokewood did produce a significant response at the May cutting time at the rate of 1.75 t/ha.
Conclusion
The response to biological products has varied across sites and in most cases product responses can be explained by the whether or not it addresses the factor which is constraining plant production. Generally it has been the nutrient in shortest supply or acidity through aluminium toxicity that have caused potential responses. If the site is constrained by nutrient deficiencies then applying the cheapest source of nutrients is generally the most cost effective option.
The soil conditioning aspects of some of the products and the potential increases in carbon may take years before they play a role in lifting yields. Soil monitoring will be used to try and pick up any soil changes. Determining if and when soil conditioning factors improves yields will be important for evaluating the products true benefits and costs. It is a financial strain on the producer to not get fast responses that help pay for the use of the product and there is probably only a certain amount of years that costs without returns can be incurred for.
Lime responses are generally not desirable as it is an indication that soil acidity has increased to a level where it’s impacting on yield and could have been for some time and that acidification at depth has probably also occurred which is more expensive to address. Lime should be used not only to ameliorate soil acidity but to prevent it from occurring.
Find out more:
Lisa Miller www.sfs.org.au
Acknowledgements
Thanks to the Corangamite Catchment Management Authority through the support of Department of Agriculture Food and Forestry.
References:
Nicholson, C (2010) Evaluating alternative fertilisers and biological products for pastures and crops. Woady Yaloak Catchment Group
Price, G (2006) Australian soil fertility manual, 3 ed. In chapter 3, Calcium, magnesium and sulphur. CSIRO publishing, Collingwood, Australia.
NSW Department of Primary Industries. Soil Acidity and Phosphorus deficiency, NSW AG Leaflet No 9.
NSW Department of Primary Industries. Interpreting tests for calcium, magnesium and calcium magnesium ratios. Leaflet 7.