This section contains snapshots of statistics surrounding world food production trends, prices and outlooks. On many occassions the discussion about future production of food on a world scale can be misleading as it fails to address population, income, R&D, GDP, government policy, infrastructure, extension, and social factors including gender and eduction, influencing food production growth in individual countries.
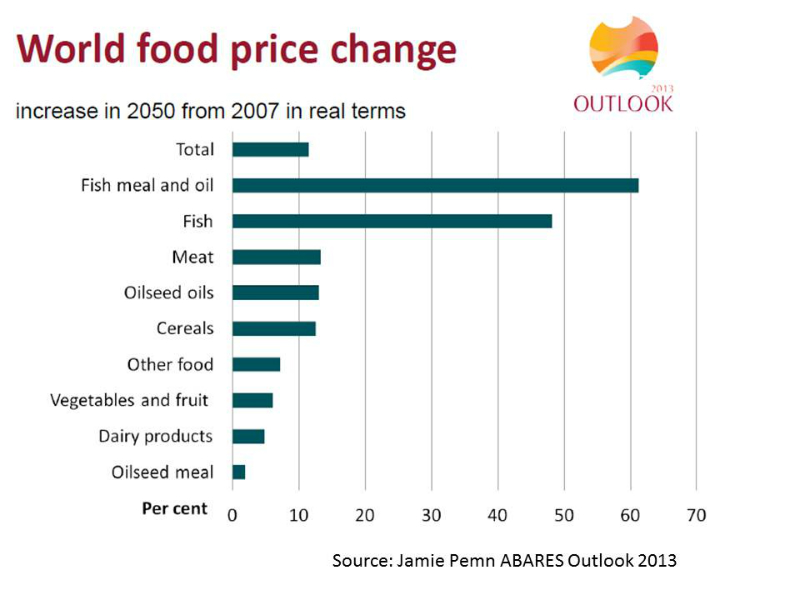
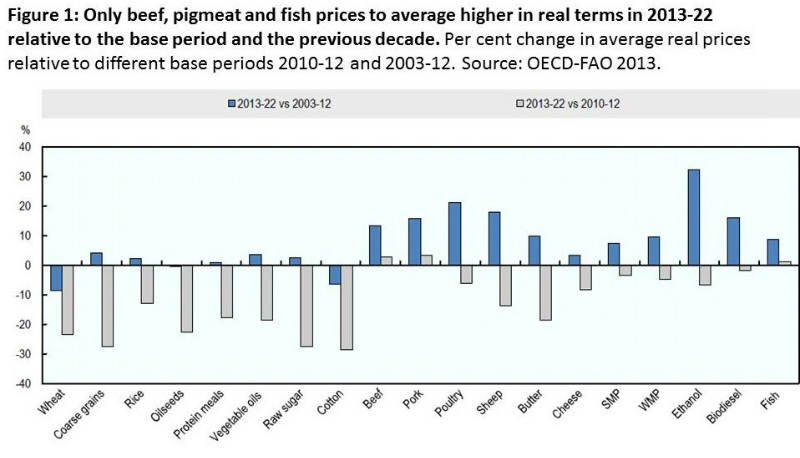
If the experts are right Australian farmers producing commodities can only look forward to minor real terms price increases over the next 35 years. The critical unknown factor is annual production variability due to climate impacts particularly in the world’s major food exporting nations.
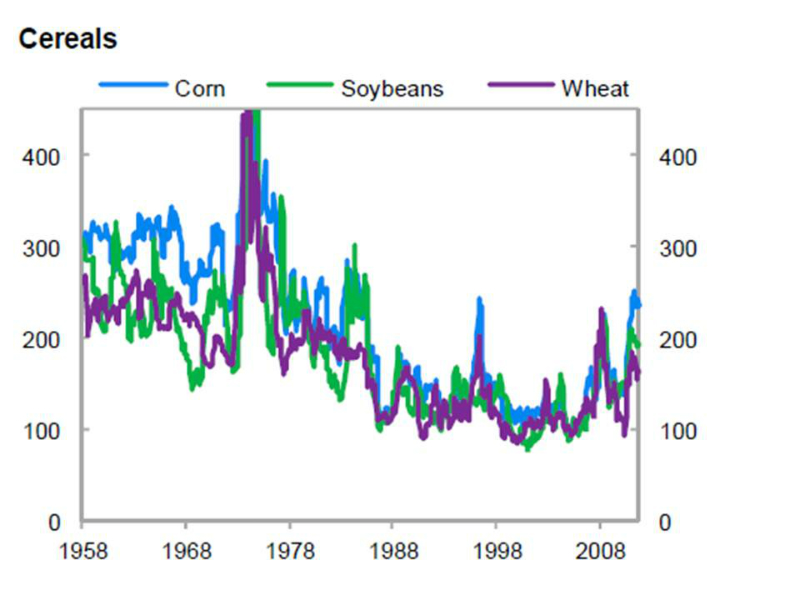
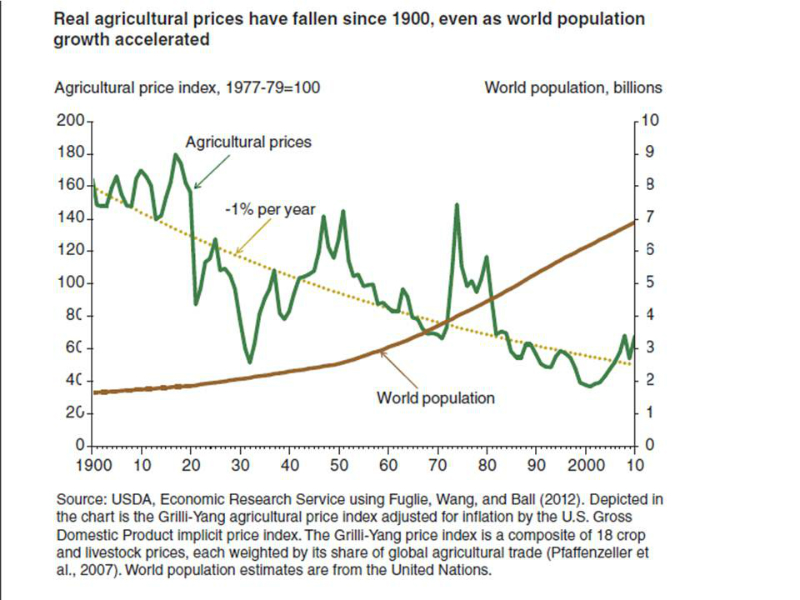
World grain price trends since 1958. Source: IMF 2011
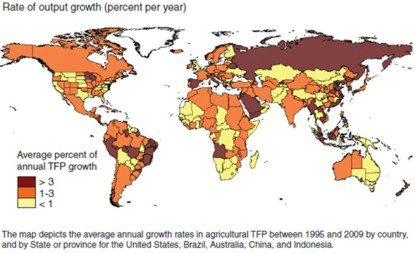
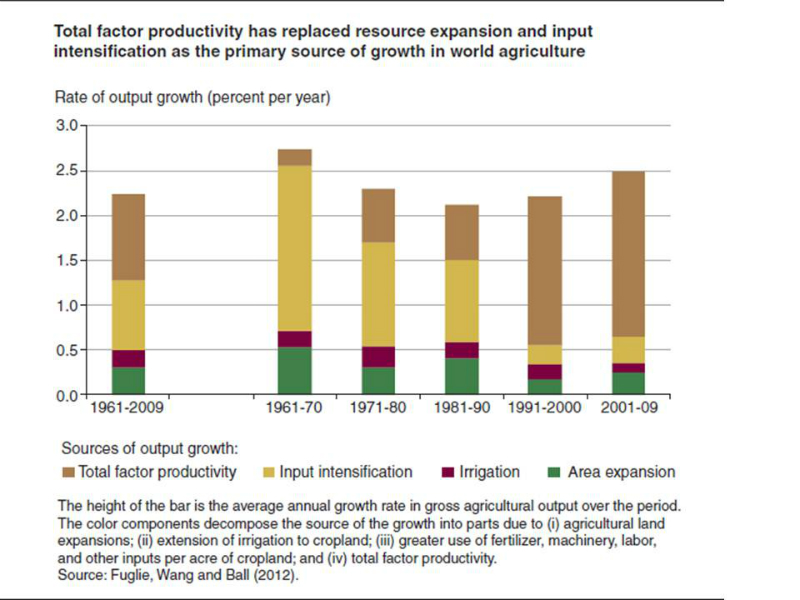
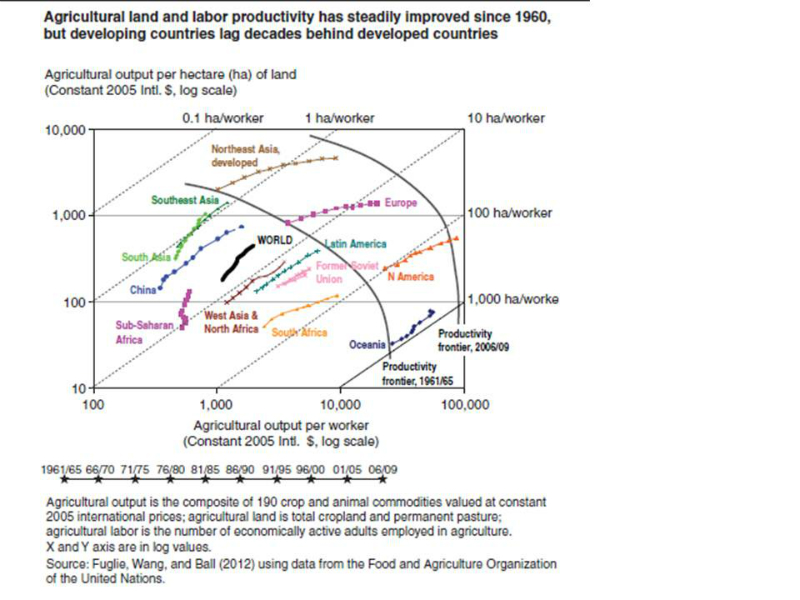
Word variation in Total Factor Productivity. This figure highlights the importance of discussing food production trends in the context of individual countries domestic production. Source USDA 2012.
Analysis by Fuglie et al demonstrates that world food production systems are changing with a raft of factors influencing each country’s ability to meet its domestic food requirement (as well as exports for some countries). It is encouraging that input requirements per unit of production are declining. Source: USDA.
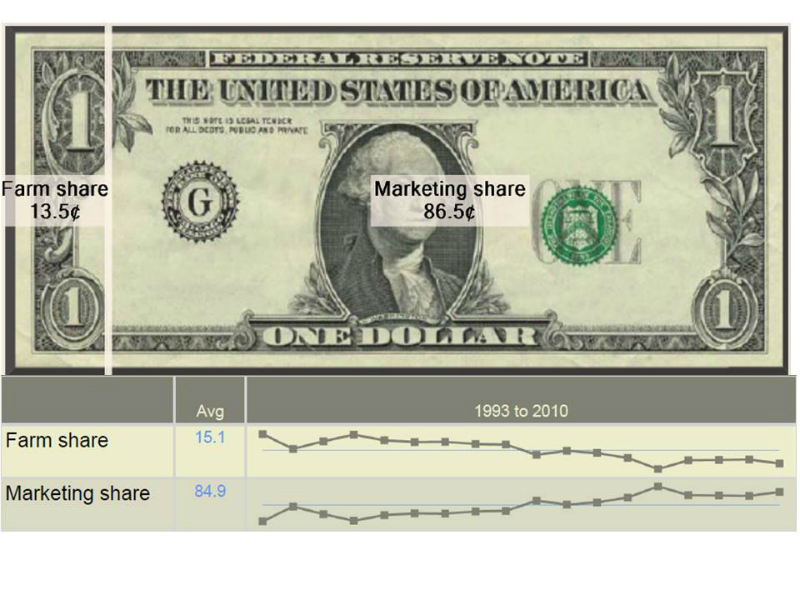
Data from the US demonstrates how farmers share of the consumers food dollar is on a downward trend. The marketing share refers to all the links in the demand chain post farm gate. Source: USDA Economic Research Service 2012.