Cleanskin breeds genetic future
 By Patrick Francis
Cleanskin sheep breeds are emerging as a significant sector in Australian sheep meat production. The Dorper, White Dorper and more recently Wiltipolls are leading in terms of popularity, particularly for sheep enterprises in the pastoral zones where variable costs for running Merinos have become too high, capital costs for maintaining sheds and quarters cannot be afforded, and labour for shearing and crutching is hard to source.
Despite the proven history of genetic selection for lifting meat sheep production using Australian Sheep Breeding Values (ASBVs), most Cleanskin sheep breeders are increasing their flocks without the adoption of ASBVs. Some of the speakers at the recent Cleanskin Sheep Australia symposium in Adelaide highlighted the implications.
Agriculture and Food WA geneticist Ken Hart emphasised the importance of measuring individual animal trait performance on as many progeny as possible and developing ASBVs in conjunction with Sheep Genetics Australia. Without them commercial Cleanskin sheep buyers are buying animals with enormous genetic variation. For new breeds giving commercial clients some confidence in genetic integrity of the animals they buy is critical for expansion.
“There is always greater variation for any trait within a breed than there is in the mean for the trait across different breeds,” he says.
Hart has been working with a 600 Dorper and White Dorpers ewes at Narrogin WA as part of the Sheep CRC’s Information Nucleus Flock to demonstrate the performance difference inherent across any Cleanskin breed and in fact across all livestock.
“Those (Sheep Genetics Australia) tools use information that is measured from the animal itself (phenotype), its forbearers (Pedigree) and offspring (Progeny). Information from the phenotype and pedigree are limiting in that they can only be collected once. Because the number of progeny is not limited they provide a potential to accumulate information. The thing that is intrinsically neat about that is that genetic improvement is about the next and subsequent generations. What better yardstick can there be than measuring the progeny of that generation,” he says.
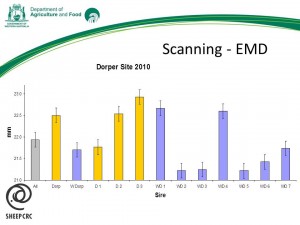
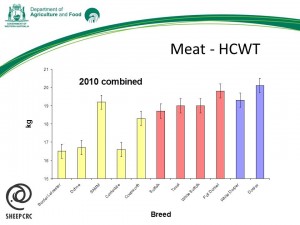
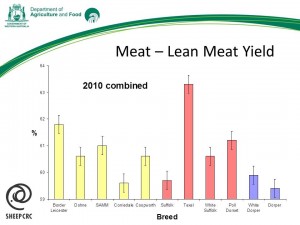
Figures 1, 2 and 3 provide snap shots of three traits measured in the Narrogin flock that clearly demonstrate that variation within a breed is greater than variation between breeds.
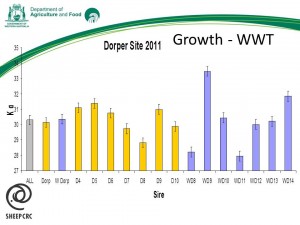
Figure 1 shows weaning weight variation. The first three bars in the histogram show the average weaning weight for all lambs (30.2kg), all Dorper (30.1 kg) and all White Dorper (30.3 kg) lambs. They show that between the breeds there is no difference in the average weaning weight.
“However if we look at the individual sires within the White Dorper group the lambs of sires WD9 and WD14 had the heaviest average weaning weight of all lambs in the trial from the 2011 drop.
Conversely the lambs of White Dorper sires WD8 and WD11 had the lowest weaning weights. So while the average weight of each breed was no different there were significant differences within the one breed.
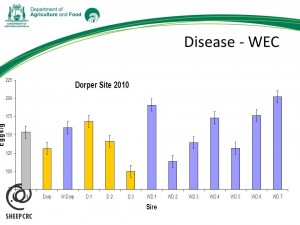
Even when the data from the small sample of sires shows differences between breeds, figure 2 for Worm Egg Count and figure 3 for Eye Muscle Depth, the differences within breed, that is between sires, are greater.
| Data Source | Sire | PFAT(mm) | Acc(%) | PEMD(mm) | Acc(%) |
| No Trial data | 400018 2010 100757 | -0.16 | 39 | 1.29 | 41 |
| Only Trial data | 470206 2007 077118 | 0.03 | 78 | 1.53 | 81 |
Table 1 shows information on two sires with there entry level data and accuracy estimates. The top sire has the basic information, which includes information obtained through his pedigree and his phenotype. The other sire did not have that information. The only information is from data collected from his offspring from the trial. Hall says the accuracy provided from the trial is about twice as reliable as pedigree and phenotypic data.
| Data Source | Sire | PFAT(mm) | Acc(%) | PEMD(mm) | Acc(%) |
| Year 1 data | 400030 2007 071209 | 0.07 | 37 | 1.13 | 42 |
| Year 2 data | 400030 2007 071209 | -0.11 | 49 | 0.80 | 50 |
| Year 3 data | 400030 2007 071209 | 0.16 | 76 | 1.80 | 80 |
| Plus Trial Data | 400030 2007 071209 | 0.76 | 89 | 2.16 | 90 |
Table 2: How data collected from progeny of one ram improves the accuracy of genetic trait information.
Table 2 shows a sire that has been producing lambs for a few years. As he has more progeny born and measured the accuracy (confidence) of the ASBV improves. The closer the figure gets to 100% the slower the rate of improvement. Even when the data is added from the trial in year four there is a significant improvement in accuracy.
“One other big advantage for industry to come from the Information Nucleus is that over time the confidence in ASBV will filter through to more and more sheep in the system. There will be more confidence in the estimates for his progeny and their descendents. In that way the system is self perpetuating and feeds on its own success. Thus the more sheep that are entered into LambPlan the more reliable it will become,” Hall says.

