
Crop WUE improvement a soil health triumph
By Catherine Norwood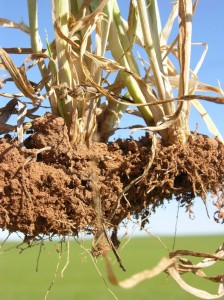
New maps detailing the water use efficiency (WUE) of wheat crops across Australia reflect the comprehensive practice changes that have taken place in the grains industry, and which have helped growers maintain production despite declining growing-season rainfall.
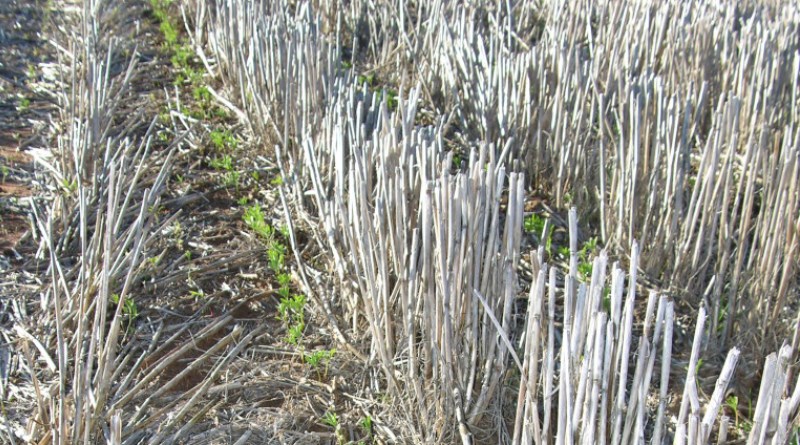
The data demonstrates that health of cropping zone soil is improving as a result of conservation farming methods which are restoring soil organic matter and structure ensuring more plant available water is present.
Between 1982 and 2012 more than half of Australia’s wheat-growing regions have improved their WUE by at least 50 per cent. Many areas have achieved even more than this.

Senior supply dynamics research officer with the Australian Export Grains Innovation Centre (AEGIC) Dr David Stephens has created national WUE maps using an analysis from AEGIC’s Stress Index (STIN) crop model. This uses data from more than 800 rainfall stations in grain-growing regions across the country.
He says the WUE improvements are a phenomenal result and have become an international success story for agronomic research. “It shows how technology and changes in farm practices have helped to keep growers ahead in the game.”
The modelling uses the French–Schultz method of calculating WUE as the actual yield achieved, compared with the potential yield standard of 20 kilograms per hectare per millimetre based on available soil moisture and growing-season rainfall.
The AEGIC model adjusts for district sowing dates based on a national sowing date survey. Rainfall that occurs too late in the season to influence yield is also excluded.
Although there are limitations with the French–Schultz method, Stephens says the analysis still provides a valuable measure.
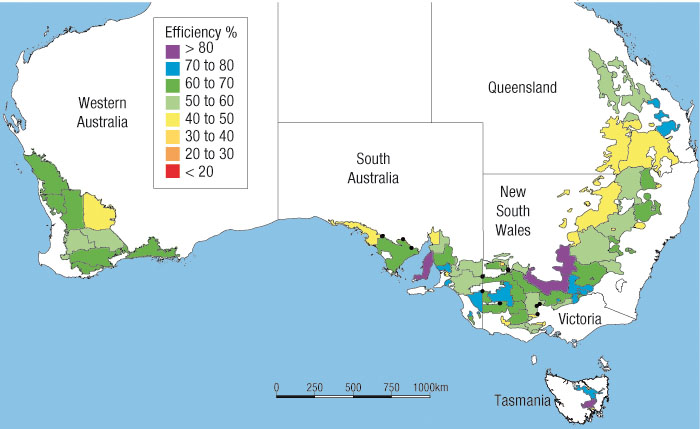
Figure 1: Average water use efficiency, wheat, 1982-86.
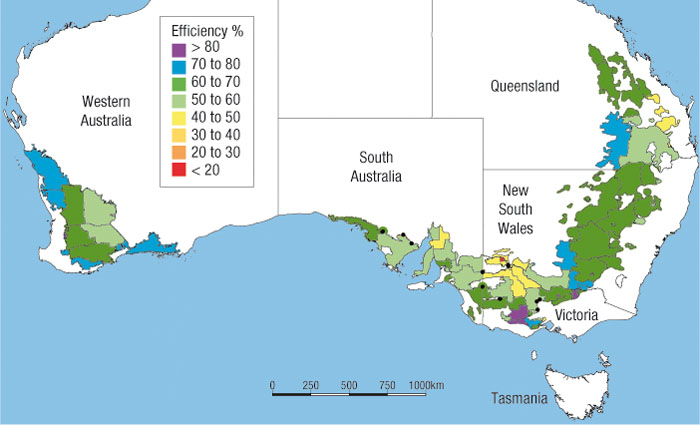
“It shows that WUE from the early 1980s was typically below 50 per cent across most of the Australian wheatbelt (Figure 1). When the same calculations were made for the three years from 2010 to 2012, the WUE across much of the wheatbelt was above 50 per cent, with many areas approaching 70 per cent (Figure 2).
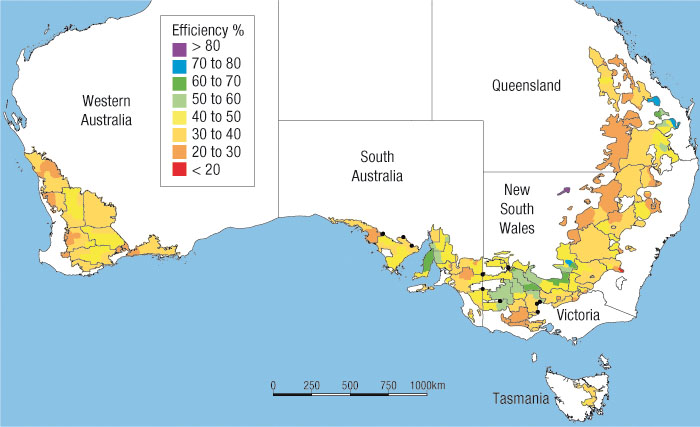
Figure 2: Average water use efficiency, wheat, 2010–12*. (*Except Queensland 2011–12)
“The percentage change between the two periods shows increases of 50 to 100 per cent – an effective doubling – across large parts of the Australian wheatbelt.” (See Figure 3).
Stephens says improved crop production efficiencies have helped growers to make more of available water, and to counter the five to 30 per cent decrease in growing-season rainfall seen since 2000.
Growers have reduced inputs in response to climate conditions and become more conservative, which has resulted in yields overall levelling off. However, yields based on available water have continued to improve.
Figure 3: Percentage change in Australian water use efficiency in wheat in 2010–12 compared with 1982–86*. (*Except Queensland 2011–2012 compared with 1982-86)
Stephens says he expects they will continue to do so, given improved crop varieties and further changes to farming practices.
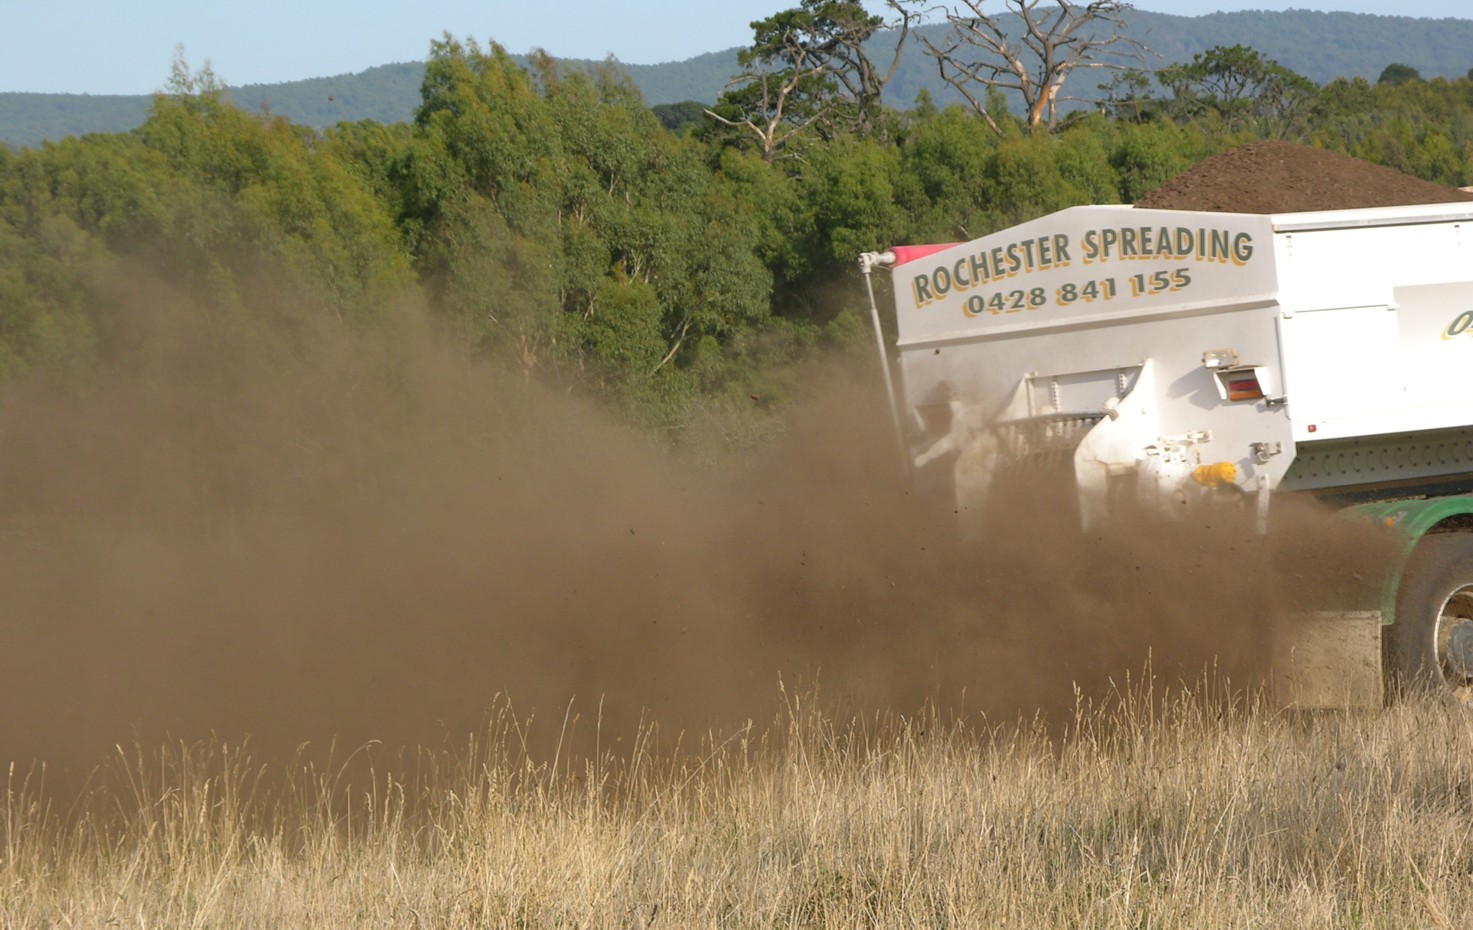
“For example, better seeding equipment, optimal input application, increased dry and deep sowing linked to optimal sowing dates, soil additives (liming, gypsum), soil structural improvements (claying) and summer weed spraying are all helping to improve WUE.”
The lowest WUE efficiencies now occur in more marginal, variable regions where growers are more conservative in their cropping and the application of inputs. The greatest improvements are found in the higher-rainfall areas of southern Victoria and Tasmania where growers have shifted their focus more from livestock to cropping systems and are using much better crop-management practices. Smaller improvements in northern Victoria are related to a reduction in long fallow and an increase in crop intensity, which is not strictly accounted for in the model.
Aggregating WUE at a state and national level over time shows how changes relate to season types, Figure 4.
Figure 4 Australian water use efficiency 1980-2013.
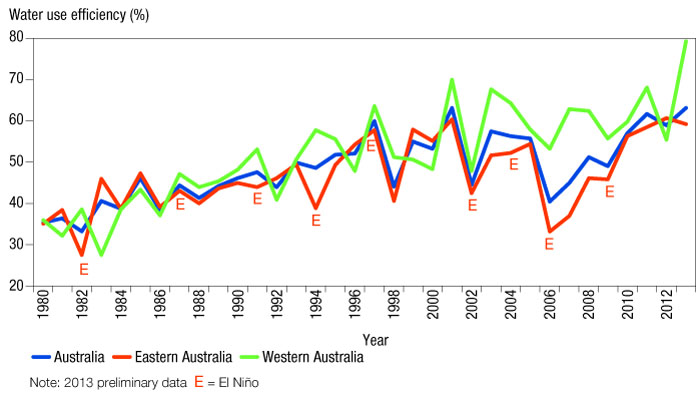
Lower WUE occurred in severe ought years, particularly El Niño years, where many paddocks were not harvested or were used to feed livestock. Lower WUE also occurred in very wet years in 1983 and 1992 in Western Australia and in 1998 in eastern Australia.
Figure 4 also shows that WUE over a longer 34-year period in WA has essentially doubled from an average 35 per cent to 70 per cent over the past three decades. The increase in eastern Australia has recently averaged 60 to 70 per cent on previous WUE rates.
Stephens says since the drought years there has been a steady increase in WUE in eastern Australia as growers have realised the importance of this strategy in the drying climate. In WA, there was a more steady increase in WUE owing to less severe climate events.
Find out more:
David Stephens, 4 May 2015; david.stephens@aegic.org.au ; www.aegic.org.au ;
Same data, but with a different interpretation would be that cropping innovation has been a massive failure over the past 20 years. Sure, WUE improved from thirty years ago, but stalled some twenty years ago.
Worse, is a likely lead time between the idea for innovation, and implementation.
Even more concerning is that we now have a massive industry of consulting agronomists – maybe some 2,300 according to Mick Keogh and the Australian Farm Institute. This should be assisted by digital communications that we could not have imagined three decades ago.
A good start to addressing this problem would be to at least put the right interpretation on the table.