
Phosphorus source comparison trial has flawed methodology
Review by Patrick Francis
The Wongwibinda, Northern Tablelands New South Wales fertiliser trial was established through local farmer interest in composts as an alternative nutrient source to chemical fertilisers for lifting and maintaining livestock productivity on pasture. The trial report authors Lewis Kahn and Sally Wright state: “the objective of the project was to contrast the effects on pasture performance of compost and superphosphate”.
However, the trial design suggests it is centered around economic performance based on outputs achieved by spending the same amount on either superphosphate or compost. If the trial wanted to contrast their effects on pasture performance , all sites should have received the same nutrient input per hectare from the different sources. The authors were aware of this requirement but chose to ignore it, stating they did not expect the extra pasture growth from compost applied at 1000 kg/ha containing 5 kg of P to compare well against superphosphate applied at 520 kg/ha containing 46 kg of P .
The reason for comparing superphosphate to compost seems to be based on the fact that soil tests on the property indicated the most limiting nutrient for pasture production was phosphorus (P). Superphosphate is usually the most readily available and lowest cost source of phosphorus.
Another reason was: “With increases in fertiliser prices and a perceived reduction in response to tradition products (chemical fertilisers), producers…wanted to examine alternate ways to increase soil fertility and optimise pasture production and maximise profitability.”
As is common with many fertiliser trials, the report gives no indication other than the soil test data, that lower than optimum P is responsible for a probable lower than optimum paddock annual livestock carrying capacity and subsequently lower livestock profitability. No data is presented by the authors that carrying capacity per 100mm of rainfall has been declining on the property or in the district.
Despite the fact that carrying capacity per 100mm of rainfall can be affected by a range of factors including changing pasture composition, grazing management and annual rainfall variability, the trial was undertaken to compare two sources of phosphorus, an organic form in compost and an inorganic source in superphosphate. No information is provided about the source of the compost.
Analysis of compost and superphosphate treatments indicated a composition (N, P, K, S, Ca, C) of 1, 0.5, 1, 0.2, 1.6 and 9% respectively for compost and 0, 8.8, 0, 11, 14, 0 % respectively for superphosphate.
The compost nutrient composition is quite different to most beef cattle feedlot manures, table 1. These have considerably higher levels of nitrogen (N) and potassium (K) than the trial compost.
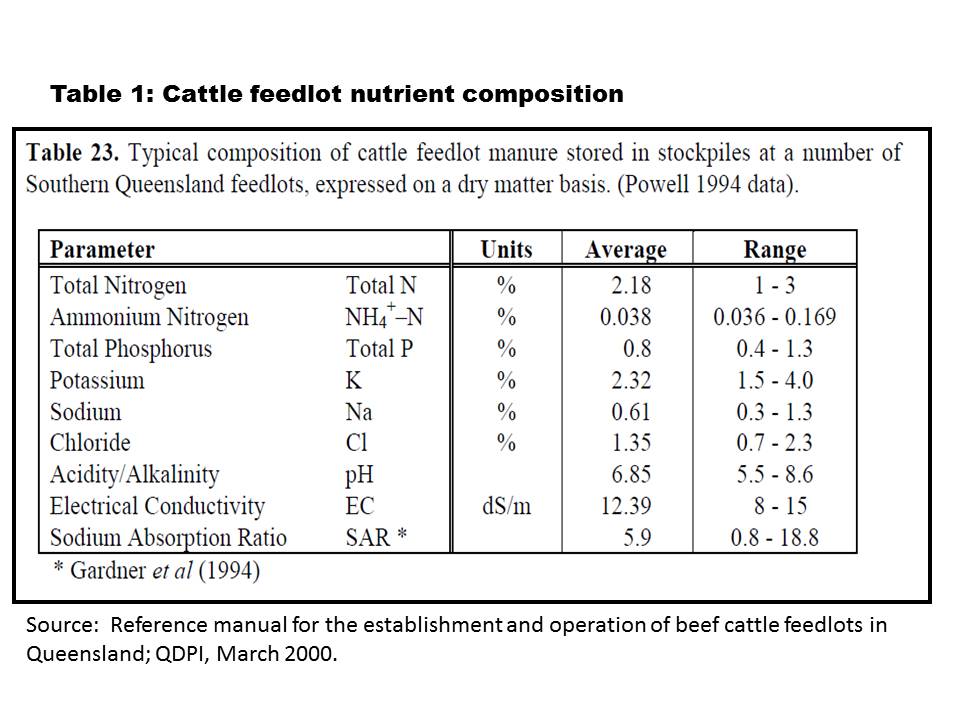
The cost of the compost ($185 per tonne) is also considerably higher than would be anticipated with commercial composted beef cattle feedlot manure priced in the order of $25 per tonne dry matter; with a further $25 per tonne for transport (200km) and $21 per tonne for spreading for a 30 tonne load – a total of $71 per tonne (author’s costs for composted feedlot manure spread on Moffitts Farm February 2016).
The trial was conducted on a pasture composed of cocksfoot (61%), microlaena (24%), paspalum (5%), perennial ryegrass (2%) and other species making minor contributions to herbage mass.
The replicated plots were mown when herbage mass exceeded 11cm (approx 3000 kg DM/ha) down to a height of 5cm (approx 1300 kg DM/ha).
The relationship between pasture height and herbage mass was linear, figure 1.
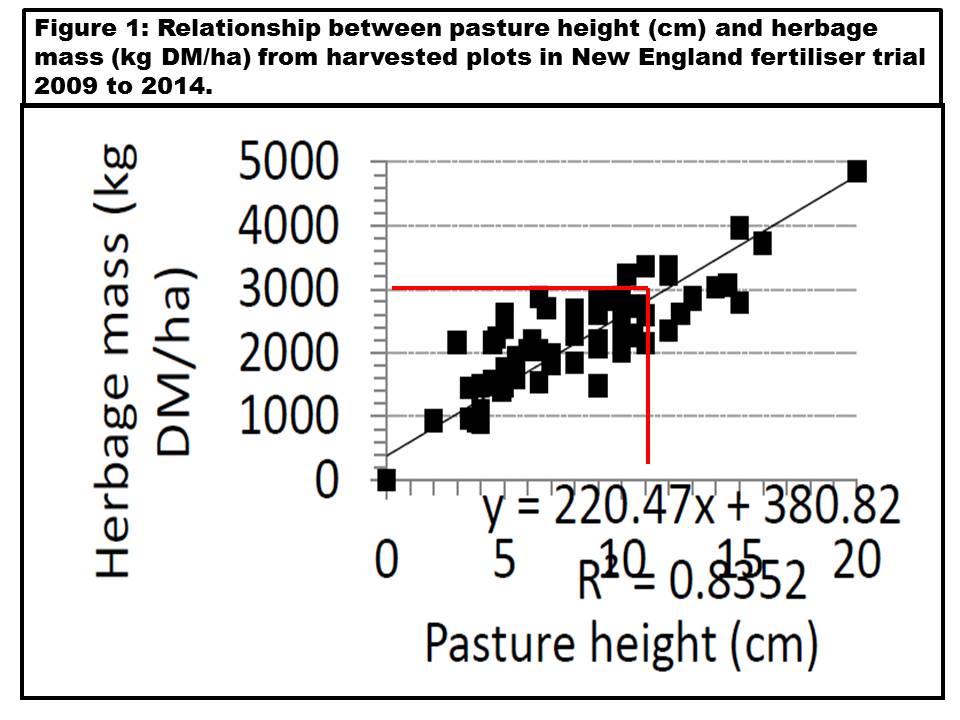
Figure 1 demonstrates that the pasture height versus dry matter relationship is reasonably close to the one provided in the MLA More Beef From Pastures, pasture ruler. At 12cm herbage mass is 3000 kg DM/ha; on the ruler 12cm is 2500kg DM/ha.
The application rates for the compost and single superphosphate are shown in Table 2.
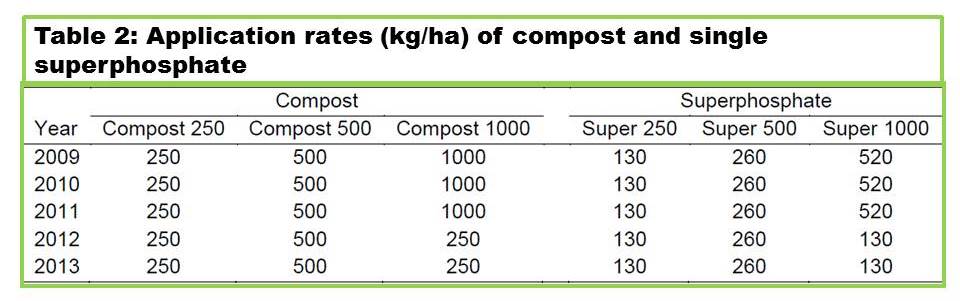
These application rates immediately flag the issue which undermines the entire agricultural science basis of the trial. The percentage of P in compost is 0.5%, so one tonne contains 5kg P. In contrast, superphosphate contains 8.8% P, so one tonne contains 88kg P. So compost at the heaviest rate applied is adding 5kg P per ha per year, while superphosphate at the heaviest rate is adding 45kg P/ha/yr and even at the lightest rate is adding 11kg P/ha/yr.
So soil levels of P and S were increased by the use of superphosphate but addition of compost did not alter the level of these nutrients from untreated control plots. This is not surprising given that compost applied at 1000 kg/ha contained 5 kg of P and 2 kg of S whereas superphosphate applied at 520 kg/ha (at the same cost as compost 1000kg/ha) contained 46 kg of P and 57 kg of S.
And there are other issues to consider with compost. It provides nutrients in an organic form which must be converted by soil biology into inorganic forms (called mineralisation), this takes time and is influenced by inherent soil organic matter percentage, temperature and rainfall. It is generally considered that approximately 30% – 50% of nutrients in compost are converted into plant available forms during the first year after application. In contrast superphosphate contains P in an inorganic form which is readily available to plants after application.
So the trial is compromised because it favours a response to superphosphate by applying superphosphate which has significantly more P/ha/yr and provides plant available form of P each year, compared with compost.
Results
The trial report concentrates on the impact of the two fertilisers on soil available P levels after five years of applications. Soil P level at the start of the trial was below optimum at 8.3mg/kg Olsen P and 20.5mg/kg Colwell P, table 3. The assumption on which the trial is based is that if the Olsen P/Colwell P can be increased, it automatically means pasture productivity increases and therefore livestock weight gains improve producing greater profitability.
Table 3: Soil chemistry (0-10cm) of the experimental site prior to fertiliser application.
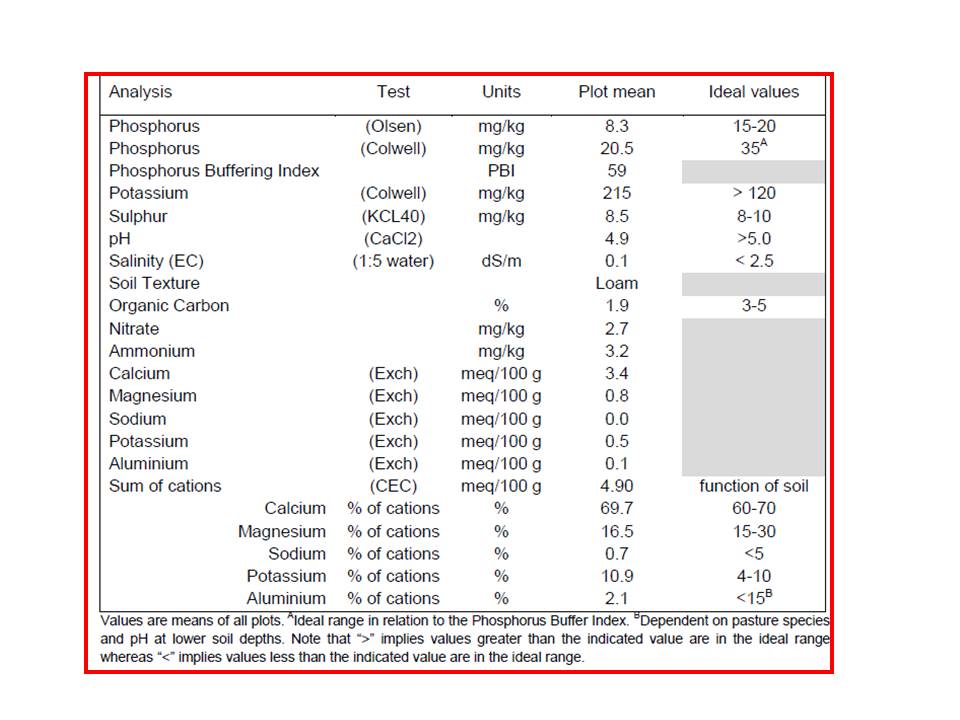
The results show that superphosphate produces higher soil Olsen P levels in all treatments compared to the compost treatment, figure 2. This is not surprising given the compost treatments provided significantly lower annual P applications, just 1.25kg/ha, 2.5kg/ha and 5.0kg/ha and all in an organic form. By contrast, the superphosphate treatment were annually applying 11kg/ha, 22kg/ha, and 32 kg/ha of plant available inorganic P.
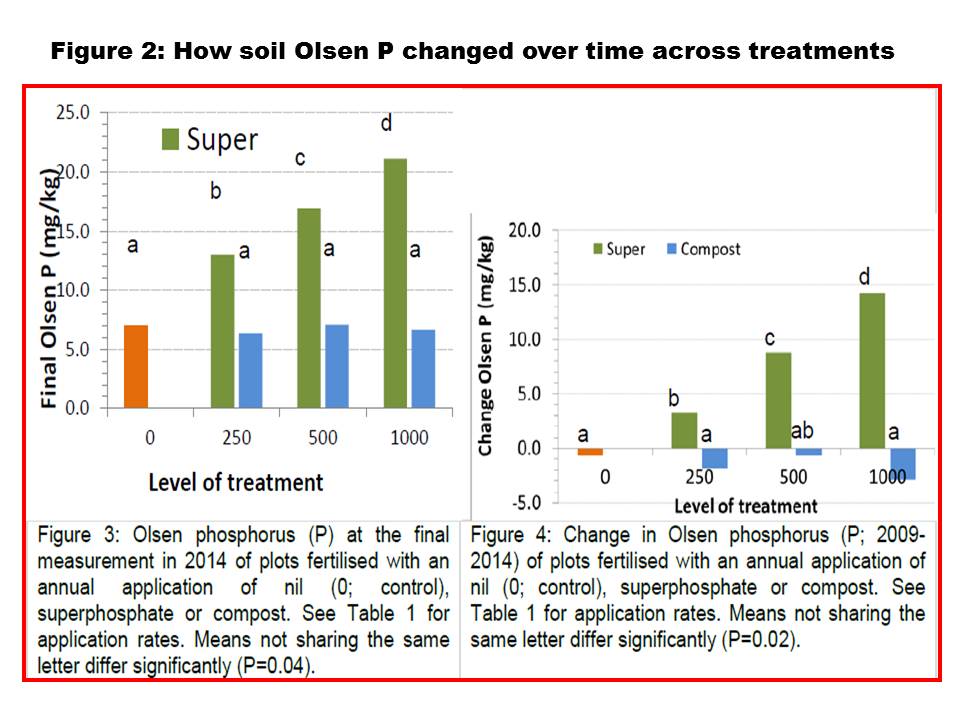
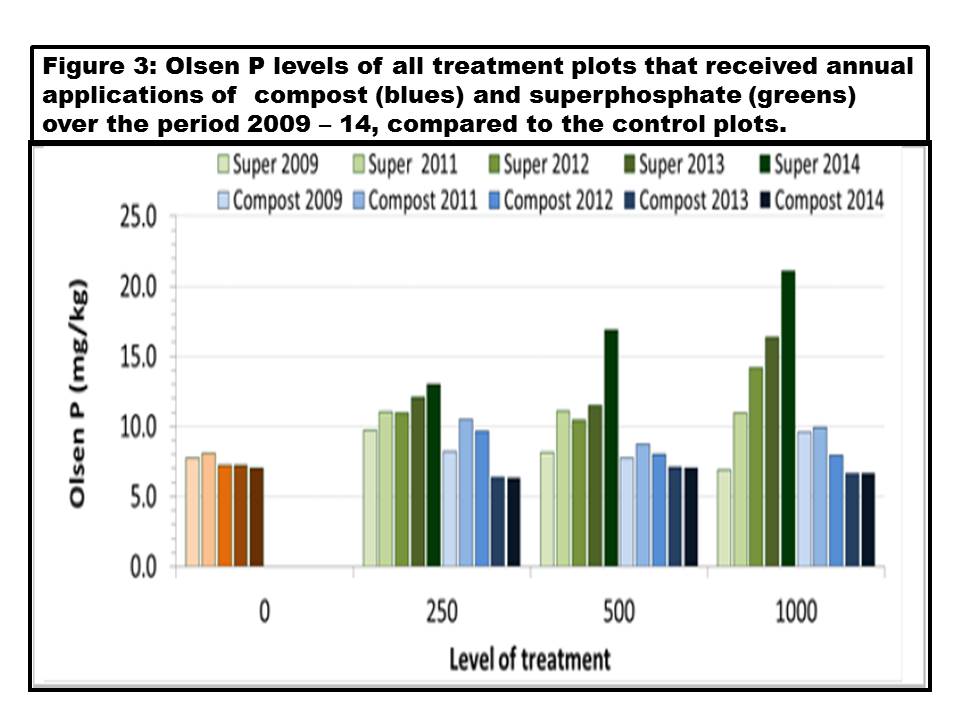
But there is more to be learnt from this trial about “chasing” optimum Olsen P levels. Figure 3 which was in the Appendix of the report, shows what happened to Olsen P levels each year across all the treatments. Only the superphosphate treatments applied significant amounts of P/ha/yr. The change in Olsen P at 11kg/ha per year was marginal, rising from 10 to 13. At 22kg P/ha/yr, there is a slight increase after four years and a significant increase in the fifth year. At 32kg P/ha/yr, Olsen P rises steadily each year peaking at 21.
When the Olsen P change is related back to pasture production per hectare each year, there is a major disconnect between the two outcomes. The above 15 mg/kg Olsen P level plots did not produce significantly more pasture than the below 15mg/kg plots in the final two years, figure 4.
Soil sulphur
As for soil Sulphur results the same significant input disparity exists. Superphosphate contains 11% S, while compost used contains on average 0.2% S. So at the lowest application rate of 130 kg/ha/yr Superphosphate, 14kg S/ha/yr was being applied. With compost at 250kg/ha/yr just 0.5kg S/ha/yr was being applied. It is therefore not surprising that soil S levels increased significantly in the superphosphate plots but not the compost plots over the course of the trial.
In other soil health characteristics there was little or no difference after five years in levels of organic carbon, Colwell K, soil pH and cation exchange capacity between the treatments and the control. This is not unexpected given the treatments applied.
Soil biology
As for changes in soil biology, determined by levels of active fungi, active bacteria and the ratios between them, results were highly variable which reflects the nature of biological population in soils. Biology varies significantly between seasons due to soil temperature and rainfall. Levels in control plots were similar to those in the treatment plots.
Pasture production
Given that phosphorus was the most limiting nutrient for plant growth at the start of the trial (table 3), it was not surprising that the superphosphate treatments which contributed 100 – 250% more P/ha/year, produced more pasture than compost over the five years.
What is interesting however, is the contribution of rainfall to the annual pasture result. In four out of the five years the control treatment produced only slightly less annual herbage than the combined superphosphate and compost treatments. In the particularly wet 2011/12 year, the treatments and the control all grew significantly higher amounts of feed compared with the other years, figure 4.
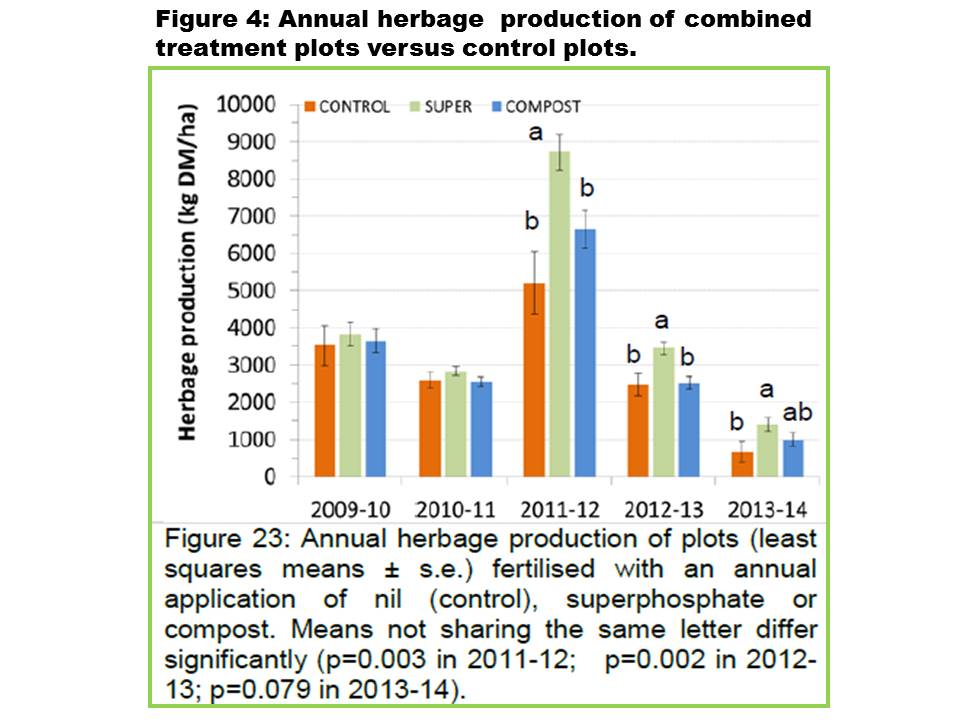
This data suggests that even in a soil where P is sub optimal, adding fertiliser on a yearly basis does not have a major impact on pasture productivity. Annual rainfall has a far more significant impact.
The report highlights the extra herbage production achieved by the superphosphate treatments over the entire five years – a total of 5790 kg. But it fails to point out that approximately 60% of the total pasture productivity gain (3700kg DM/ha) happened in the wet 2011-12 year which was also the high production 12 months for the control and compost plots.
The economics of applying superphosphate compared with no fertiliser would only be favourable in that year, and would be close to break even or a loss in the other four years. The reader cannot determine which superphosphate rate is likely to be most economic because the trial authors have bulked all the superphosphate treatment responses together to show the average pasture response across the different rates. It is difficult to know why this was done and represents a significant flaw in the data reporting.
The same is true for all the compost treatment rates compared to the control, its cost of extra herbage grown made worse by a dubious cost put on the compost ($185/t).
All I can conclude from the data about pasture production is that in four of the five years extra pasture produced from superphosphate or compost would hardly cover the cost of treatment.
Looking deeper at the results for the 130kg superphosphate/ha rate which is the one most farmers would use on pasture, they show:
* Compared with the control approximately 2500 kg/ha of extra pasture was grown over the five years.
* 1500 kg/ha of this was achieved in one year when spring/summer rainfall was above average.
* The remaining extra 1000kg/ha was achieved over four years, or 250 kg pasture DM/ha/year.
* With superphosphate costing $356/tonne, the 130 kg /ha rate cost $48/ha/yr.
* In four out of five years the extra 250kg DM/ha grown cost $48 or 19.2 cents per kg dry matter.
On this analysis the farmer would have to question whether the outlay of $48/ha was better value than perhaps buying in feed or adopting a grazing management program which improved pasture growth.
On the trial farm the pasture response to compost was even less rewarding. Even at 1 tonne per ha rate there was an extra 2000 kg/ha pasture grown over the five years compared to the control plots with 1500kg/ha of that grown in the high rainfall year.
So in four of the five years the compost cost at 1t/ha was $186 to grow just 125kg/ha/yr of pasture, or $1.55/kg of extra dry matter.
Compost too expensive
If phosphorus is the major nutrient limiting pasture growth on the trial site, using compost at $186/t to rectify was never a commercial reality.
In a P limited pasture soil, the animal manure of choice is poultry litter as it contains approximately 1% to 1.5 %P or 10 to 15kg P per tonne. If sourced and spread at around $50 per tonne DM, then the P cost is just $3.50 to $5 per kg. In this situation poultry manure P becomes competitive with superphosphate P on a cost per kg basis. In this trial the cost per kg of P in superphosphate is $4/kg. The cost of P in the compost in this trial was exorbitant because the material cost $186/tonne and contained just 0.5% P. So the cost per kg P is $37.20.
But using composts is not just about supplying plants with phosphorus, it contains a suite of nutrients as well as carbon, which can contribute to plant productivity and soil health. When composts can be landed and spread at a competitive price they become a cost effective alternative to chemical fertilisers.
Lisa Warn, University of Melbourne Mackinnon Project, reviewed the use of poultry manure as a fertiliser and concluded: “Poultry litter can be an economic alternative to inorganic fertilisers. Litter composition varies as does its price in different districts, but the economic value can be calculated. In the short-term, surface applied litter can produce similar pasture and crop yields to inorganic fertilisers, when nutrient are applied at the same rate. In the long-term changes in soil chemistry could give greater responses.” (Mackinnon Newsletter November 2012).
This demonstrates it is critically important to have an accurate analysis of livestock manures when they are being considered as an alternative to chemical fertilisers. It is just as important as knowing what soil nutrients, if any are limiting pasture growth.
Other considerations with fertilisers
What is not known about P in the high input superphosphate plots is how much is lost to the environment each year or when soil saturation occurs in a wet year. It should be remembered that in the first two years of the trial, the two higher superphosphate treatments were receiving 20 – 28 kg/ha/yr more P than the two higher compost treatments, but pasture production had little to show for it. This extra P must be adsorbed to soil particles and be of potential risk of leaching into ground water or creeks.
Further analysis of the pasture production showed significant increase in white clover content in the superphosphate plots compared to the compost plots. Once again, simply explained by the significantly higher inorganic P applied to these plots and the demand the short root while clover plants have for this form of P. The compost application rates were far too low to see a response from white clover.
A point not considered by the report authors but is economically important for farmers, is what to do with the increased pasture production achieved in the one year a significant response to fertiliser and compost was achieved. In that year there was approximately a 200%, 100% and 70% increase in pasture production per hectare in the superphosphate, compost, and control plots respectively versus production in the other four years. With farm carrying capacity more likely orientated to the long term average rather than the exceptional years, most farmers may not be able to take economic advantage of the increased pasture growth in a one year in five event.
Given the exceptionally high rainfall in 2011/12 was an eastern states event, virtually all farmers have potential to increase carrying capacity pushing up the price of store animals.
Take home message
This trial was scientifically flawed from the start by applying 100% to 200% more P/ha/yr in one product compared to another product to correct a perceived soil phosphorus deficiency. The treatment plots should have all been given the same annual rates using the different types of fertiliser to see if the source impacted production and cost of dry matter produced.
The small differences in pasture productivity between the control or no fertiliser plots and the compost and superphosphate plots in four of the five years demonstrates that making decisions about annual fertiliser inputs to chase and maintain optimum soil Olsen P levels may be financially unrewarding.
A more valuable approach is to base fertiliser application on broadacre pastures on nutrient budgets over say a four to five year period. In this approach nutrients removed in livestock products (meat, wool) per hectare are replaced with a four or five year application of the fertiliser of the farmer’s preference.
Monitoring pasture livestock carrying capacity in every paddock is a vital component to fertiliser application decision making. If the lack of a particular nutrient or extreme pH is impacting pasture growth over time, then it will be picked up in carrying capacity trends for each paddock.
If hay or silage or a crop is grown and products removed off paddock, then the budget needs to replace nutrient exports from these products as well as in livestock on an annual basis.
The background to this trial gave no indication as to what was happening to paddock livestock carrying capacity on the farm involved. Olsen P was below what is commonly believed to be the optimum level for maximum pasture growth, but there is now growing evidence to suggest a much more complex interactions exist between soil nutrients, soil biology, pasture species, grazing management and seasonal rainfall than can be solved by simply increasing soil Olsen or Colwell P levels.
Evidence from three major alternative fertiliser trials, Westernport Landcare Network, Holbrook Landcare and Binalong Bookham Landcare show poor relationships between soil available P levels and pasture productivity. In these trials as in this one, the control plots produced close to the same amount of pasture as the conventional fertiliser and alternative fertiliser treatments in most years.
Data from the Victorian DPI’s “Making Better Fertiliser Decision”, figure 5 confirms the high variability associated with soil Olsen P level and optimum pasture productivity. Figure 5 shows that across soil types there are sites where close to maximum pasture yields are achieved when Olsen P level is below 15 mg/kg.
Figure 5: Relationship between percentage maximum pasture yield and soil Olsen P test values.
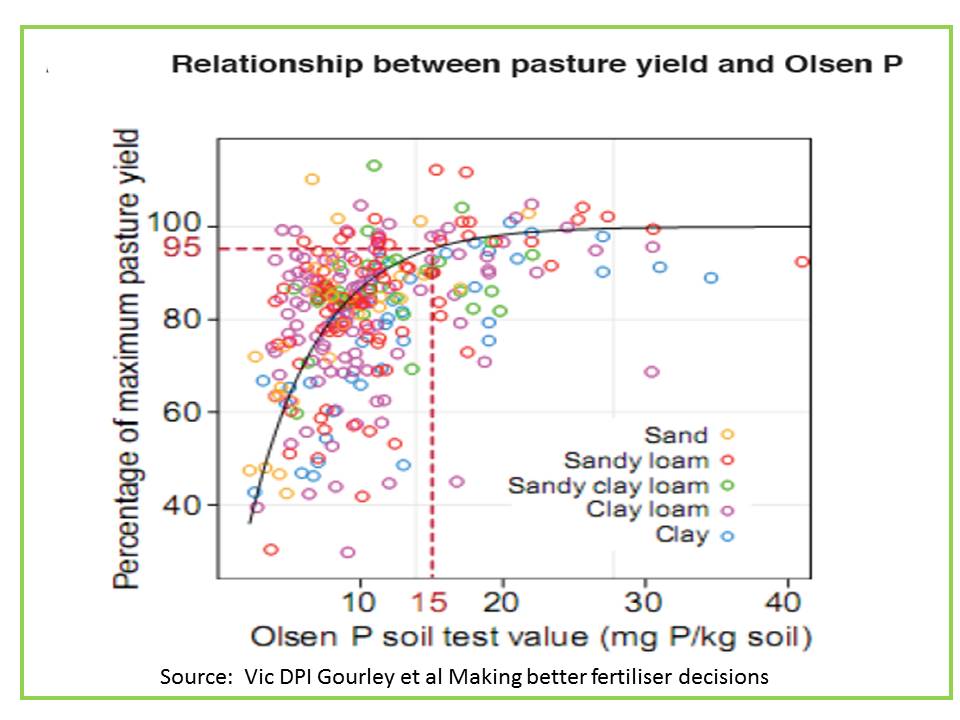
This suggests a holistic approach is needed with fertiliser decision making. It is likely to be far more rewarding to manage nutrients on an import-export budgeting basis at the individual paddock level than to chase specific levels of nutrients. The proviso to this recommendation is that soil pH, nutrient levels, biology, physical structure and perennial species content are being monitored regularly in conjunction with recording annual paddock carrying capacity.
Unless farmers know paddock carrying capacity trends it is virtually impossible to decide on what course of action is needed to increase production per hectare and per 100 mm of rainfall.
Craig, My reading of the Australian agricultural science literature suggests much lower phosphorus losses than you indicate, with the actual amount depending on a range of intrinsic soil factors, grazing management, fertiliser use and timing – both organic and inorganic, and rainfall conditions. Cameron Gouley et al have produced a method of calculating the Farm Nutrient Loss Index (FNLI) for each paddock – check “Making Better Fertiliser Decisions for Grazed Pastures in Australia” to find out more.
Your question of how much superphosphate may be lost to the environment each year prompted me to search Google scholar, and the first result was a study by NK Fleming from grazed dairy pastures in South Australia with an abstract that reads “Over 92% of P, 76% of total dissolved C, and 93% of S was lost in overland flow.” So it’s likely a lot of it. A worrying aspect of that is just what happens when that P ends up in streams with some N.
I’d be trying to stem those kinds of flows rather than adding fertilizers.