Monitoring farm environmental trends
By Patrick Francis
The key objectives of any credible farm environmental management program should include recording, monitoring and evaluating trends in environmental health indicators.
Armed with this information the landholders involved have a powerful tool to tell the story about positive environmental outcomes as result of their stewardship, be it conventional, organic or holistic farming, lifestyle land ownership, or government land ownership. Too often food processors, retailers and farmers are attaching environmental credentials to products using emotive terms such as “natural” , “sustainable”, “free range” without any credible evidence demonstrating improving trends are taking place.
It is important to acknowledge when monitoring that the starting point is not as important as the trend in the indicators over time. These trends are important to know for the land owner’s stewardship methods, and for consumers and society’s recognition of efforts made. It is also important to realise that monitoring some environmental indicators involves biological systems that change extremely slowly and significant improvement may only occur over a decade or even decades.
I have derived a list of farm ecosystem health indicators which are rarely produced as evidence by farmers and retailers claiming environmental stewardship applies to the foods they sell. Environmental credibility by association can also be misleading for consumers. For instance organic certification usually means environmental factors associated with crop and livestock production are looked after. But the key difference between organic and conventional farming is the absence of artificial chemicals and fertilisers which does not guarantee continuous improvement in environmental indicators. The other common association being increasingly made is between natural or free range livestock production and environmental sustainability.
For example, Woolworths is now marketing Australian Grasslands Tender Cut Beef which claims on the label it is “sustainably produced grass fed beef as nature intended”. The label information continues: “We focus on long term environmentally sustainable outcomes for all areas of production”. There is no credible support for this claim insomuch as there is no requirement for the suppliers to monitor, record and report trends for environmental indicators which contribute to sustainability of each supplier’s farm ecosystem.
Not all indicators provided in tables 1 and 2 apply to all properties or public land. They represent a selection which if monitored on a regular basis (could be annually or even once in five years) will provide landowners with an indication of the consequences of their natural resource management. Most of the indicators suggested can be monitored by the land owners, but some do require commercial laboratory testing (eg soil tests) or special instrumentation (eg ground water table access and salinity/nutrient measurement) and help with interpretation.
The distinction between positive indicators and ‘negative’ indicators is important. Consumers, the public, and agencies want to know about the positive indicators. In general, improvement in the ‘Negative’ Indicators is an expectation, that is, the public expect that landholder stewardship would ensure these indicators are looked after. They are synonymous with the public expecting the food they buy is safe to eat.
Farmers often put significant weight on the ‘Negative’ Environmental Indicators as improvement of them are important in terms of lowering cost of production. The financial impacts of the Positive Environmental Indicators are often not apparent to farmers as they are not known about, or never measured so their link to productivity is un-recognised. The key issue about the Positive Environmental Indicators is that once farmers make the link between them and improved productivity or lowered cost of production their interest in future measurement is assured.
The bottom line
The Positive and ‘Negative’ Environmental Indicators shown in tables 1 and 2 have exciting implications for types of land ownership and farming systems. Irrespective of the branding used by a landholder, be it certified organic, “Natural”, “Free range”, Landcare Farming, no-till farming, cell grazing, holistic management, or even a conservation covenant, etc, if the appropriate group of indicators are monitored and measured, the environmental impacts of the stewardship used will become apparent with time.
There is another important consequence of monitoring in different farming systems. Outcomes are likely to vary between the systems so over time there will be the opportunity to learn, then mix and match components that may have even better outcomes for our natural resources on agricultural land.
Tables 1 and 2 contain comments from a farm consultant who is orientated to boosting productivity with higher fertiliser and chemical inputs and has had little exposure to biological farming principles and holistic decision making. He asked to see my list of environmental indicators. I have left the consultants comments in both tables to provide readers with some insights into the lack of understanding which is common amongst many farm advisors. I have made brief responses to these comments indicated by the notation “PF”.
Table 1: Some Positive Environmental Indicators
| Indicator | How measured | The potential story | Conventional farm consultant’s comments & Pat Francis response | |||
| Soil organic carbon level | Request with standard soil test | Sequestering CO2 via plants into labile and non-labile components of soil organic carbon mitigates greenhouse gas impacts, improves soil water holding capacity, improves the soil food web. | How sure that the CO2 will not be released when next we plough.PF: It will be released, that’s why no-till systems are recognised on the Chicago Climate Exchange carbon credit scheme | |||
| Plant available phosphorus level and total soil phosphorus | Standard soil test | P important for plant growth, excess soluble P can contribute to river pollution. Reduction in P application will reduce opportunity for waterway and estuary pollution. | How much P is too much.PF:Soil science has guidelines for different soil types, see DPI Ellinbank work by Goulay | |||
| Soil nitrogen | Standard soil test | N important for plant growth, excess water soluble nitrogen can contribute to ground water and river pollution and increase soil acidity. Reduction in nitrogen fertiliser application will contribute to a reduction in production of nitrous oxide an important greenhouse gas. | What tools do we have to increase this amount of N produced by legumes? Do we need to revisit the legume inoculation story.PF: Generally speaking most farmers are good at growing sub clovers – these plants always recover from drought because of the hard seed. What most farmers are not good at is maintaining productive perennials hence we see so many compacted onion grass dominant pastures with a reasonable component of sub clover in Victoria and SA | |||
| Soil acidity | Standard soil test | Increasing soil pH to around 6 ensures more nutrients are available to plants. | How and at what cost, I know it’s good but is it economicalPF:Combined with grazing management correcting pH is likely to be the most economical method of boosting pasture production providing other nutrients are not seriously deficient. | |||
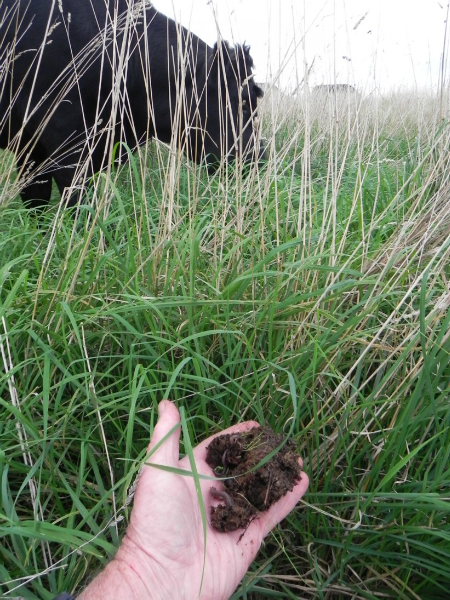
| Soil microorganisms | Specific laboratory test; observation and smell | Abundance and ratio of soil microorganisms reflects soil health, organic matter content, plant available nutrients and plant disease prevalence. Part of the soil food web | How do we increase them?PF: Grazing/croping management that allows development of organic matter. Takes a management paradigm shift eg retaining stubble – no burning. Shifting stock OUT when pastures eaten down to 1600 kg dm/ha – NOT shifting them in at this FOO | |||
| Soil worms and invertebrates | Observation, smell and counting | Increasing worm number and invertebrate’s species diversity in the top 5 cm of soil reflects soil health, percentage ground cover, soil organic matter and soil water holding capacity. Part of the soil food web. | How do we increase the population.PF: AS ABOVE | |||
| Ground cover | Observation and estimation | 100% ground cover, year round, comprising either plant litter or plant crowns ensures protection from wind and water erosion; protects soil microorganisms; raises soil organic matter and carbon; improves soil water holding capacity; improves farm dam water quality; improves livestock productivity and welfare; and minimises opportunity for weed invasion. | Is 100% realistic and if not how low can we go and still get an improvement.PF: YES – anything less compromises points above – the paradigm hasn’t changed and with climate variability the way it is now the new system won’t have a chance. | |||
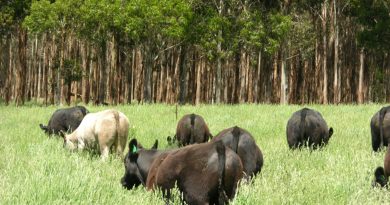
| Plant perenniality | Observation and counting | In grasslands and grassy woodlands 70% pasture plant perenniality means 100% ground cover is more likely; ensures high soil water use (potential for year round green); ensures less recharge of salty ground water; improves carbon sequestration, and improves livestock productivity and welfare | ||||
| Biodiversity: native plants & animals | Observation and counting | Increasing diversity reflects management that looks after key components critical for native animal existence, eg a healthy soil food web and healthy and abundant habitat in both remnant vegetation and farm land. | ||||
| Area of remnant and riparian vegetation protected; and area of revegetation including forestry | Observation and measurement | Ensuring 10 – 20% (some cases up to 30%) of a farm property is protected remnant (or revegetated) and riparian vegetation contributes to biodiversity improvement, endangered species protection, water quality improvement , landscape quality improvement , improves carbon sequestration, and improves animal welfare. | OK so where do we start? By adding to what we have or starting where there is no shelter and gradually joining it up?PF: BOTH | |||
| Stream water quality | Laboratory test for nutrients and minerals;observation and recording water invertebrates; salinity meter | Decreasing nutrients, minerals and sediments in waterways reflects a high level of adjacent land and riparian stewardship. | So what is the test regime which gives enough info and is doable by a time poor farmer.PF: Easiest is just observation – is water clear or turbid or muddy? Insects, frogs/tadpoles, native animals eg platypus, water rats etc in and around water. Key is diversity of species, more diverse healthier the water. Chemical composition needs lab tests. | |||
| Ground water table level | Measurement and observation | Where the ground water table is salty, keeping it 2 m or more below the surface is critical to prevent dryland salinity, and road and building damage. | Deep rooted plants? –Natural sequence farming?Key line?Drainage?PF: First is essential othersshould not be necessary in Eastern Aust if ABOVE points are in place – still helps in WA where perennials non-existant. | |||
| Rainfall utilisation | Records and calculation | Cropping and livestock systems that produce more output per 100 mm of rainfall reflect stewardship is being implemented that improves soil water holding capacity | But the greater the utilization of GSR the greater the risk.Opposite is the case – lift organic matter and hold more water in the top soil – grow more crop and pasture per mm. 2007 is classic example – those who captured higher proportion of early season rain are likely to achieve close to ave yields. | |||
| Irrigation water utilisation | Records and calculation | Cropping and livestock systems that produce more output per mm of water applied reflect improved water use efficiency in food production, and stewardship is being implemented that improves soil water holding capacity and management that prevents losses into the water table or into water courses | As abovePF: As for rainfall utilisation | |||
| Energy use | Records and calculation | Declining (non-renewable) energy use per unit of livestock or grain produced means reduced greenhouse gas emissions. | Need to give some pointers.PF: Key one for farmers is diesel use in cropping – no till CTF systems reducing diesel by 30% or more.
With pastures – shifting from feeding hay/silage to no feeding has significant fuel etc savings. |
|||
| Greenhouse gas balance | Records and calculations | Farms with declining greenhouse gas emissions are positive for the world environment; those that are net carbon sinks are even better. | How to measure, need a quick calculator.PF: Visit www.farminstitute.org.au for farmgas tool | |||
| Fertiliser use and nutrient balance | Records and calculations | As soil health improves as a result of an increasing soil food web, more nutrients are made available to plants by microorganisms. The amount of artificial nutrients being applied per unit of livestock or grain output should decline. | Agree. That means more monitoring and testing, no problem there.PF: Not necessary to monitor more – need to establish benchmark with paradigm change – it needs time to show soil test results so monitoring frequently doesn’t help. | |||
| Livestock and crop output | Records and calculations | On farm land the livestock and crop produced are part of the biological system. Their output per ha, and per mm of rainfall reflects the health of the system. Healthy farm ecosystems will at least maintain but more usually increase output per ha or per mm of rainfall as natural resources improve. | But the risk has to be considered.PF: Point here is that it is critical to know output per ha or per mm to understand impacts of management changes, climate changes, combination of both. Not enough farmers know this. |
Table 2: Some ‘Negative’ Environmental Indicators
| Indicator | How measured | The potential story | Conventional farm consultant’s comments & Pat Francis response | ||
| Weed incidence | Records and observations | Incidence of weeds will decline as management strategies are put in place which encourage dominance by desired plant species. Weeds are a symptom of other problems in the system eg bare ground from overgrazing, failing to control pest animal species | Agree, but where to start.PF: Doesn’t mean monitoring whole farm – can start with indicator paddocks eg for incidence of weeds using a standard 100 m line. | ||
| Pest animal incidence | Records and observations | Pest animals are declining with carefully planned and carried out control programs. | Agree , so maybe we need some contractorsPF: Yes more contractors would help – most pest animals are district issues not individual farm issues. | ||
| Pesticide use | Records and calculations | As farm land management and stewardship improves requirement for pesticides such as herbicides to control weeds and insecticides to control insect pests declines. This reduces risk of exposure to humans, food and the natural environment. Even pesticides such as anthelmintics to control intestinal worms in livestock will decline as improved plant growth, rotations and spelling leads to less pasture contamination and improved animal nutrition. | Agree | ||
| Farm waste | Records and action | Farmers can reduce their pollution footprint by using bulk, recyclable (re-usable) containers, covers and wrappers and ensuring these are recycled on a regular basis. | Agree | ||
| Farm waste organic | Records and action | Animal and crop byproducts such as manures, prunings etc are valuable organic products that if stored and utilised appropriately can improve the natural resources on farm land. | So, how to store and use.PF: Dairy farms and feedlots store effluent and pump it onto pastures at right time of year. Mulching orchard prunings then using the mulch to provide ground cover and prevent weed growth along rows etc |