AWI performance report card fails to relate to farm profitability
By Patrick Francis
Australian Wool Innovations Ltd 2012/13 Report Card demonstrates an increasingly common characteristic amongst agribusiness corporations – don’t mention trends in farmers’ business profitability. This is extraordinary since AWI admits it is the “research, development and marketing organisation for the Australian wool industry”. What’s more its mission is to invest on its farmer levy payers’ behalf to “to enhance the profitability, international competitiveness and sustainability of the Australian wool industry and increase demand and market access for Australian wool”.
But the Report Card gives no factual evidence – positive or negative, about wool growing business profitability and sustainability. Under the AWI’s three key strategic areas: On-farm R&D, Off-farm R&D and Marketing, a range of initiatives are highlighted which may have a bearing on profitability on some farms but these are on the periphery of the fundamental factors affecting return on investment and profitability of wool growing businesses.
It is also surprising that AWI’s Strategic Plan 2013/14 to 2015/16 also fails to analyse Merino wool production profitability trends under the “operating environment” section. It says “One of the major determinants of woolgrower profitability is the price of wool. …AWI investment can impact greasy wool prices through time”. But no data is presented about what is happening to actual and inflation adjusted prices of the key micron indicators over the last decade and what impact, if any, its marketing programs over that period have had on Merino wool consumption and price.
AWI program Benefit Costs analyses are characterized by optimistic demand outlooks at the retail level and ignore the Merino producers’ financial reality. There is also a failure to point out in the Strategy that increased demand even if it does happen does not equate to improved profitability if Merino wool farmers cannot capture a greater share of the consumers dollar spend.
Why AWI is not held more accountable for its impact on profitability could stem from the changes taking place in Merino farming structure. ABARES alludes to this in its annual 2013 Farm Survey report where it defines the sheep industry as: “representing the more specialised producers of sheep and wool. Currently, sheep industry farms account for only 30 per cent of Australia’s wool production. Most wool and sheep meat production occurs on mixed enterprise farms, particularly on mixed livestock–crop industry farms.”
In other words the majority of wool produced is grown on farms where other enterprises/products are likely to be the dominant focus of attention. According to ABARES the specialist sheep farm businesses are on average in significant financial trouble as farm business profit has been declining for the last three years, table 1. The decline reported highlights another issue, the lack of data surrounding meat sheep as opposed to wool sheep production, in other words differences between specialist Merino wool growers who produce some meat versus specialist sheepmeat producers who produce some wool. The projected decline in sheep farm business profit in 2012-13 reported by ABARES is in part due to lower sheep meat prices compared to the two previous years.
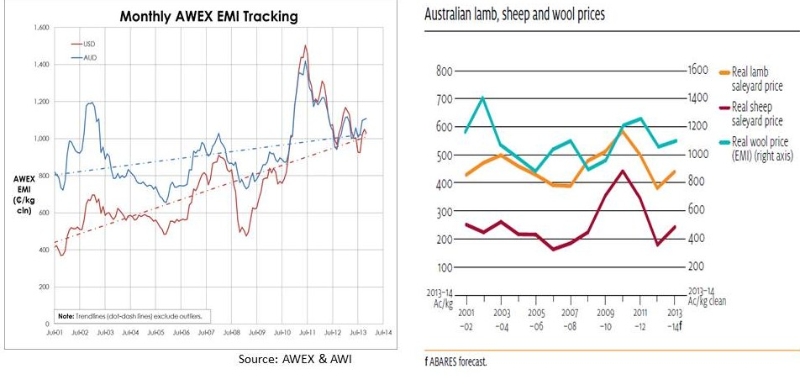
AWEX wool price trends are available on the AWI web site. There is an interesting comparison between the AWEX Eastern Market Indicator (EMI) price trend since 2001 and ABARES real time (adjusted for inflation) EMI for the same period, figure 1. While the AWEX graph demonstrates a positive trend line in Australian dollars over the 11 years, the real time EMI demonstrates that prices are now significantly below what they were in 2001 in 2012/13 dollar terms.
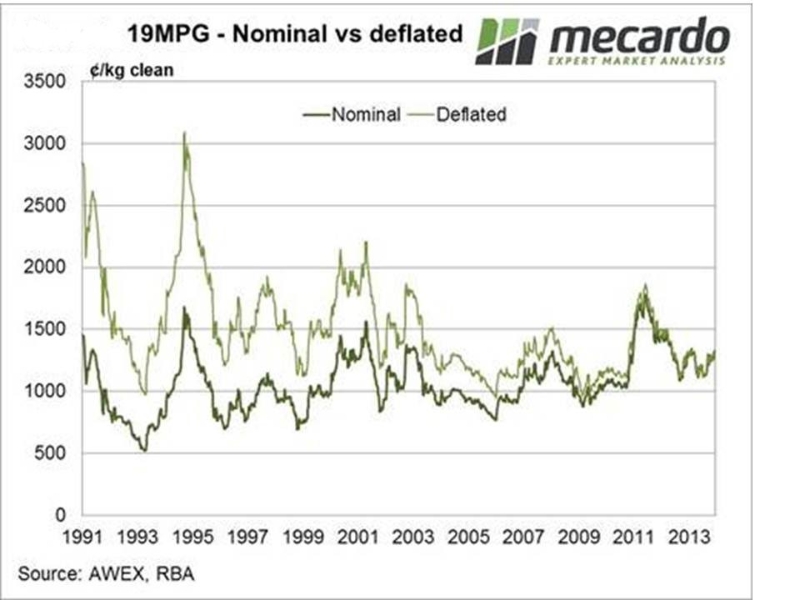
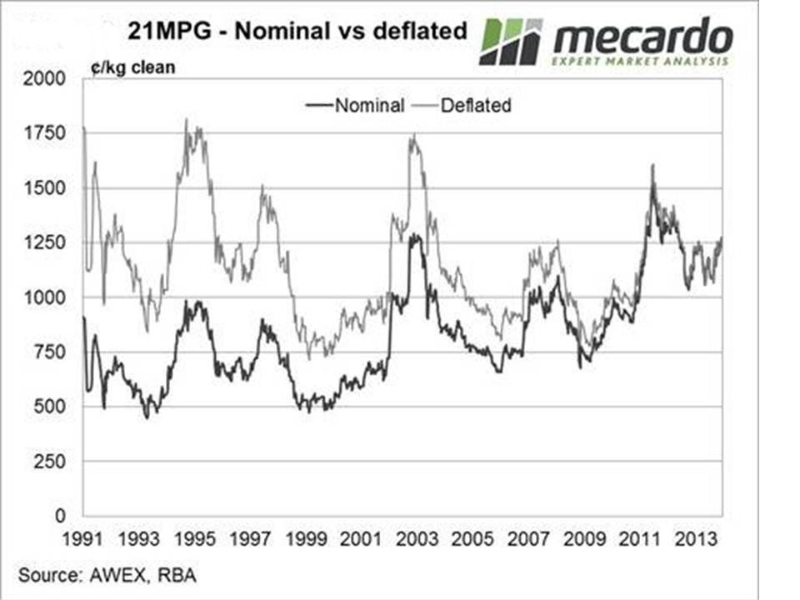
A closer look at the inflation adjusted 19 and 21 micron “bread and butter” micron indicators since 1991 (when the reserve price scheme collapsed) is even more revealing. The trend for inflation adjusted price for 19 micron wool shows it is now below what it was in 1990’s, figure 2. The decline trend in the inflation adjusted price for 21 micron wool is not as great but it means the prices now are about what they averaged in the 1990’s, figure 3.
Given the drop in sheep meat prices over the last 18 months back to 2001 inflation adjusted levels, combined with the Merino wool prices equal to or less than in the 1990’s, then it is not surprising why farm business profit on most wool sheep farms is declining. This is clearly stated in the ABARES report. It says the percentage of sheep farms with negative farm business profit has increased from 45% in 2010/11 to an estimated 67% in 2012/13.
While data on specialist wool farm profitability is not available in the AWI Report Card, neither is any trends data about the use of wool in apparel and interiors. This is despite AWI’s Off-farm R&D objective “to develop a range of product and process innovations to increase the use of wool in apparel and interiors”.
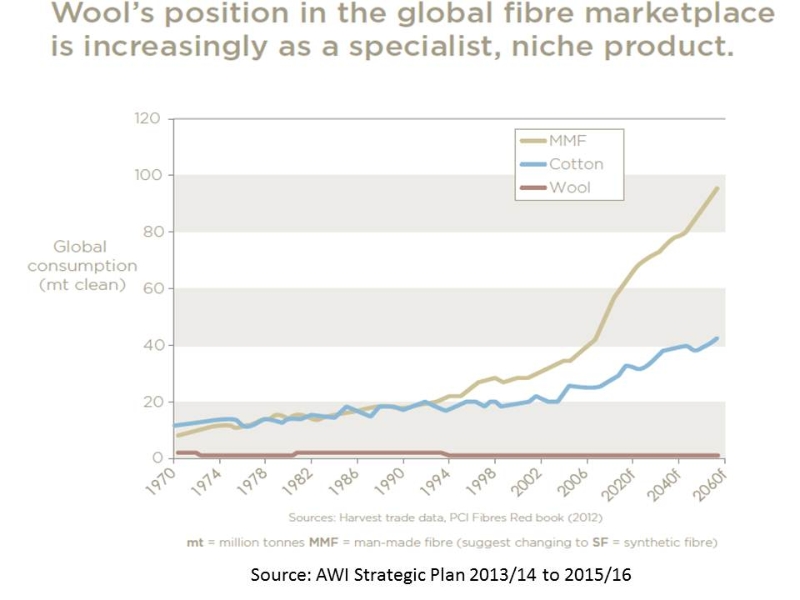
Surely AWI has the staff and industry contacts who could provide accurate annual estimates of the amount of Australian Merino wool with different fibre characteristics being spun into tops, yarn and fabric by processors around the world? When a specific marketing program is significantly successful then there should be some evidence for it in Merino wool processing data. The only data included in the Strategic Plan is generic about world’s textiles usage over time, figure 4. Even this is not positive as wool is a minor and declining component, and Merino wool’s share is even smaller.
The Strategic Plan’s commentary about figure 4 is far from encouraging: “These annual increments in alternative fibre production dwarf global wool production, which has plateaued in the 1.0 – 1.1 mt per annum range, and is forecast to remain so. Accordingly, wool’s share of the global market will inevitably decline to less than 1% by 2040, and Australia’s share thus to around 0.25%.”
The same lack of data characterises AWI’s marketing portfolio which aims to increase the return to woolgrowers by creating demand among consumers. The marketing portfolio utilises 60% of AWI’s annual investment, receiving $24.5 million in 2012/13. For instance when AWI says it “provided supply chain training to 206 partners…and assisted 76 partners with product development”, what “bread and butter” Merino wool demand outcomes are such initiatives likely to produce? Are such generic initiatives sufficient to create demand for specific Merino wool types with particular credence values associated with genetics, husbandry methods, environmental outcomes, or geography? These are factors farmers can control or influence through their management and do impact consumers purchase decisions.
China Luxury Program analysis
AWI undertakes and publishes some benefit cost analyses of its initiatives and final outcomes should be analysed and included in the annual Report Card. In August 2012 the company published the benefit cost analysis for its China Luxury Program which was a $3.2m investment over two years 2011 -12. This program is aimed at “…women’s luxury market where wool is viewed as a traditional and outdated fibre. It seeks to reposition wool as a high quality fibre for women where it is seen as stylish, elegant and tasteful, and relevant to contemporary fashion”.
Six designer partners with 1100 stores across major cities in China were engaged. The benefit of the program to Australian woolgrowers was stated as” being higher prices for greasy wool” as a result of increased demand for wool. The extent of the price rise the benefit cost analysis says will be determined by: the price effect – responsiveness of demand at the consumer level and the extent to which this price increase is passed back to Australian woolgrowers; and the volume effect – increase in demand for 18micron to 22micron wool that is generated by the Program.
The analysis estimated that the AWI investment in the China Luxury Program over 2011 to 2013 “will generate benefits to Australian wool growers of between $0.8million and $11.3million in present value terms” through to 2023. The benefit cost analysis concludes that after year 1 average increase in wool usage across the partners was actually 14%. Usage data for 2012-13 has not been updated in the report and there is no indication which types of Merino wool with which credence values stand to benefit from increased demand.
This lack of type information is puzzling because in an October 2011 AWI media release “Australian Merino inspires China’s luxury market” the company said AWI will also create a design studio on a Merino wool farm to be known as “The Wool Lab” where designers will undergo training in the infinite versatility of Merino wool. The Wool Lab will contain over 500 carefully selected yarns and fabrics from 60 elite manufacturing partners in the UK, Japan, Italy and China from which the designers can select materials and begin creating their own branded collections.”
This media release also revealed another well known characteristic of consumers willing to pay a premium price: “Today the luxury market in China, like the rest of the world, is driven by more than glamour and ‘hype’. Luxury consumers are interested in values of heritage, quality, provenance and craftsmanship. They want to know what (is) the substance behind the brand and its product,” explained Sam Guthrie, Global Business Development Manager at AWI.
Acknowledging these characteristics is why New Zealand Merino wool farmers are so successful in participating further along the textile value chain than most of their specialist counterparts in Australia.
Campaign for Wool program
Another benefit cost analysis of the Campaign for Wool program which supported European retailers partners to the tune of $4.05 over four years between 2009/10 and 2012/13, was released in August 2012. It had similar aims and time frames as the China Luxury Program and would generate benefits to Australian woolgrowers of between $3.0million and $22.4 in present value terms up to 2024. The analysis gave no indication that any increase in wool sales had been achieved. The 2013 Report Card throws no light on any outcomes from the Campaign for Wool investment.
One other marketing program has an incomplete benefit cost analysis but suggests positive outcomes for wool growers through increased demand and higher wool product prices is the Merino Touch campaign. It spent $2million between 2008/09 and 2011/12.
It is intriguing to note that AWI’s Framework for Monitoring and Evaluation 2011/12 includes metrics for strategic investment programs. For the investment targets of topmakers, spinners, weavers and knitters there is no metric for kilograms of Australian Merino wool produced as tops, yarns or textiles. For fibre and product marketing targeting brands, retailers and wholesalers there is a metric “kgs of wool sold” from partner declarations as part of the contract with AWI. None of the program benefit cost analyses referred to above includes “kgs of wool sold” and even if they did would such generic information be useful to wool growers who are paid for specific fibre characteristics and quality?
Take home message
The profitability of Merino wool growing businesses is not well documented other than for general trends without specific references to particular types or credence values. In this regard most Merino wool growers have little feedback as to demand trends post farm-gate. Price trends for micron indicators show that after accounting for inflation the price this year is equal to or less than it was in the 1990’s.
Report cards and the Strategic Plan produced by AWI provide little data about profitability of different Merino wool production sectors. While its Benefit Cost analysis of specific marketing programs are optimistic about creating demand at retail level and subsequently producing higher prices, no supporting processing and production data for specific wool types involved is presented.
In many respects Australia’s specialist Merino wool farmers could be equated to sitting in a rudderless dingy in an ocean of textiles while man-made fibres and cotton producers sit in massive container ships fitted with the latest high technology guidance systems controlling the direction they are heading. In contrast, New Zealand’s Merino wool farmers are in a smaller dingy than the Australians but they equipped themselves with the most up-to-date guidance systems to ensure they are heading in a profitable business direction.
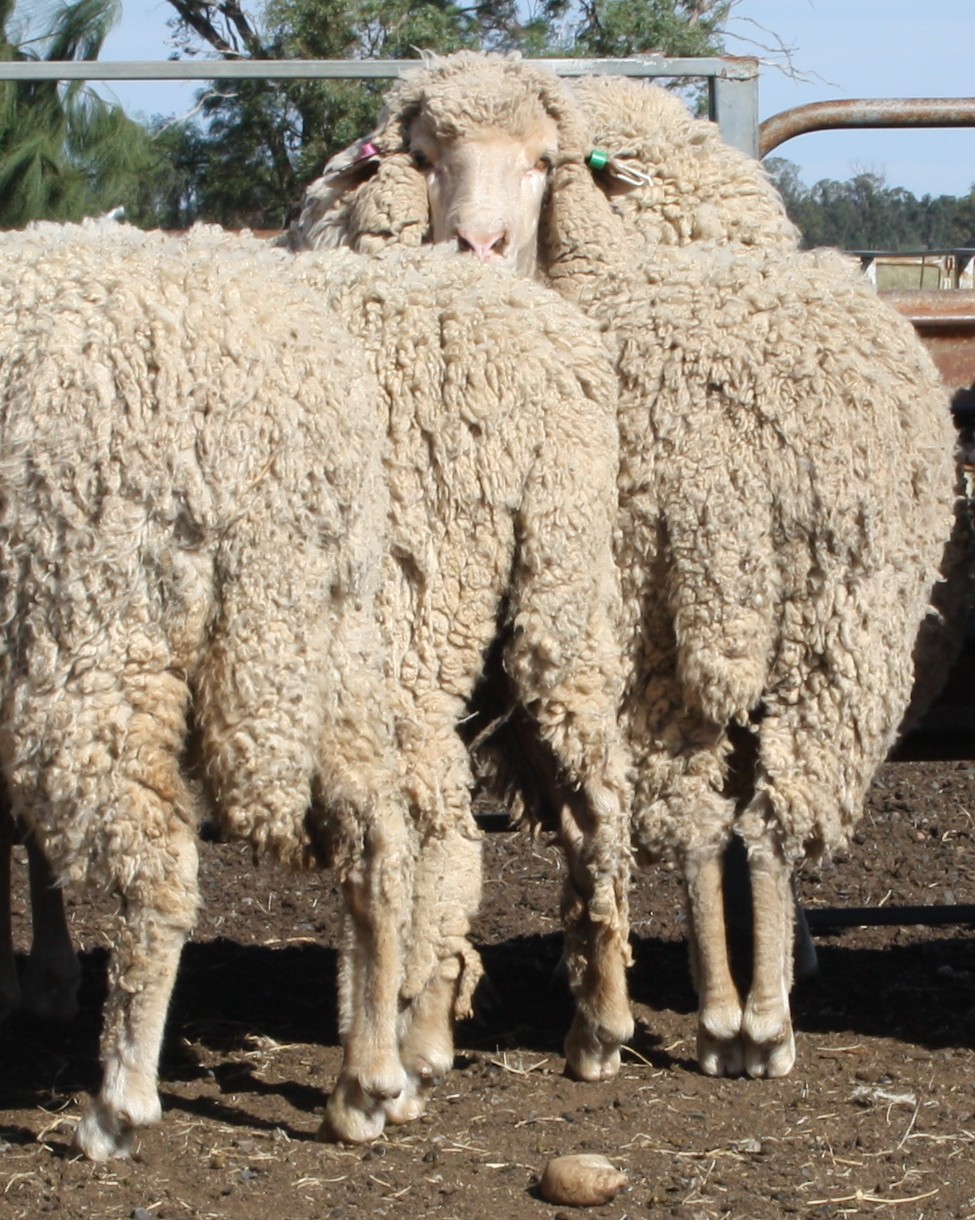
Cover fleece photo from Well Gully Poll Merino Stud, Mitchell, Queensland, www.wellgully.com.au