Too much phosphorus fertiliser applied on many pastures and crops
By Patrick Francis
The rationale behind farmers applying phosphorus (P) fertiliser to pastures and crops as an annual routine, based on the concept that is must be needed to optimize productivity, has been called into question by a major review of soil test results across southern Australia. It follows on a host of trial results which demonstrate that once a moderate level of available P is in the soil, adding more has no extra benefit and not only may it be a complete waste of money, it can contribute to water way and reservoir degradation.
In 2010 David Weaver, WA Agriculture and Food, and Mike Wong, CSIRO Land and Water WA, analysed the P balance of farming systems across southern Australia to south east Queensland in relation to P management and soil properties at farm and sub-farm scales. Phosphorus input, yield of products and soil data were collected to assess soil chemistry and Phosphorus Balance Efficiency (PBE; percentage of P inputs harvested as P outputs) of sheep, beef, dairy and cropping systems.
What they found calls into question many of the recommendations for phosphorus fertiliser made by agronomists each year. The median P balance efficiency was 11% for sheep, 19% for beef, 29% for dairy and 48% for cropping. This means that on sheep farms only 11% of the annual application of P was actually removed in sheep products – wool or meat. So 89% of the P from each application remained in the soil. In contrast, 48% of the P applied to crops was exported off farm in grain or hay, so 52% remained in the soil.
Weaver and Wong calculated that the Phosphorus applied in excess of product removal (P balance) ranged from 18.1kgP/ha/yr for dairy to 6.1 kg P/ha/yr for cropping. The bicarbonate-extractable (Colwell) P concentration of surface soils increased with fertiliser application and this differed in relation to P Buffering Index (PBI), production history and the rate of P input.
What is particularly telling in this review is that soil test values for 63% to 89% of soil samples from pastures and crops exceeded critical values (CV) as defined by PBI, Colwel P and land use, when little yield improvement would be achieved by applying additional P. This indicates many agronomists are ignoring what soil tests are indicating and recommending P applications regardless. Some may have a conflict of interest between advice and fertiliser sales.
The environmental concern from the analyis is that a greater percentage of these soil test values exceeded thresholds for water contamination.
Farm-gate data for 339 enterprises and an additional 437 records data for specific products were drawn from a number of sources . For the 339 enterprises, there were 159 farm-gate budgets for beef, 78 for dairy, 28 for mixed cropping and grazing, 7 for cropping and 67 for sheep. For the 437 records for specific products, there were 161 farm-gate budgets for beef, 66 for milk, 88 for sheep meat, 63 for wheat, 29 for wool and 30 for cropping in south east Queensland.
CSBP Limited made available 109,000 soil test (0–10 cm) data records for soils from south west Western Australia (WA) for the soil sampling seasons of 2008/9 and 2009/10. In addition, data from 2,160 dairy soil samples (0–10 cm) collected in 2007 and 2008 from 44 Australian dairy farms were made available. This dairy soil data included 316 samples from New South Wales, 181 from Queensland, 138 from South Australia, 313 from Tasmania, 897 from Victoria and 315 from Western Australia.
Farm-gate P budgets
The Phosphorus Balance Efficiency of Australian pasture and cropping enterprises (excluding those from SE Queensland) had median values that differed significantly between cropping, dairy, beef and sheep. Weaver says the landscapes on which these enterprises are based are typified by positive P balance and therefore P accumulation.
“There was variation within enterprises and instances where PBE was greater than 100%, occurring where P inputs are low or nil, and hence where existing soil P reserves were utilised. Phosphorus inputs to cropping, beef and sheep were not significantly different, whereas for dairy, P inputs were significantly greater than the other enterprises,” he says.
Across the farms the median P inputs were 9.8 kg P/ha/yr for sheep, 11.3 kg P/ha/yr for beef and cropping, and 25.6 kg P/ha/yr for dairy. Phosphorus outputs were lowest for sheep farms, then beef, then cropping then dairy with the medians being 1.1, 1.9, 5.6, 7.7 kg P/ha/yr. Dairy farms had a median P balance of 18.1 kg P/ha/yr which was significantly greater than the other enterprises, whilst cropping had the lowest of 6.1 kg P/ha/yr.
Farm output in yield of meat, wool or grain increased significantly in the order sheep then beef then cropping then dairy with median output mass increasing from 187 to 244 to 1,878 to 5,544 kg/ha/ yr respectively.
Dairy enterprises had the highest P inputs, P outputs and P balance. Additionally, dairy enterprises exported the greatest mass, 95% of which was as milk output. Weaver says the bias in output mass from milk is offset by the differences in P concentration of milk and animals, such that around 70% of the P output from a dairy enterprise is in milk.
“Almost all of the P output from dairy enterprises could be balanced with P inputs from feed, with no significant difference between feed P inputs and enterprise P outputs, and no significant difference between feed P inputs and milk P outputs,” he says.
Beef enterprises had the same P output and output mass in animals as dairy enterprises, hence differences between these enterprises in P output were largely due to milk P output since around 95% of output mass from beef enterprises was as animals, with the remainder as feed.
Sheep enterprises shared the lowest P inputs with beef and cropping enterprises, but had the lowest P output. Wool contributed around 10% of the output mass from a sheep enterprise, but only 1% of the P output because of the low output mass and very low P concentrations in wool. The low P output and PBE is therefore a function of the lowest output mass of all of the evaluated enterprises and the overall lower P concentration of live sheep, since sheep used the same P input as beef and cropping .
Cropping enterprises had the highest PBE probably because of its lower trophic level, and high output mass and product P concentration resulted in high P output for relatively low P input.
Table 1 Typical P inputs (kg/ha/yr), P outputs (kg/ha/yr), P balance (kg/ha/yr), PBE (%), and output mass (kg/ha/yr) for major enterprises.
| Dairy | Beef | Cropping | Sheep | |
| P Inputs (kg ha−1 yr−1) | ||||
| Feed | 4.2–7.4 | 0.2–0.6 | 0.1–1.5 | |
| Animals | 0.1–1.0 | 0.3–1.3 | 0.1–1.9 | |
| Seed | 0.3 | |||
| Fertiliser | 14.8–19.4 | 9.1–11.4 | 10.9–12.0 | 7.0–9.5 |
| Irrigation | <0.1 | |||
| Precipitation | 0.1 | 0.1 | 0.1 |
0.1 |
| TOTAL INPUT | 20.7–27.3b | 9.9–12.3a | 11.2–12.3a | 9.0–12.1a |
| P Outputs (kg ha−1 yr−1) | ||||
| Milk | 3.9–6.2 | |||
| Animals | 1.6–2.1 | 1.5–2.2 | 0.7–1.5 | |
| Wool | 0.005–0.01 | |||
| Crops/Hay/Silage/Grain | 0.1–0.8 | 5.1–6.4 | ||
| TOTAL OUTPUT | 5.3–8.5d | 1.6–2.2b | 5.1–6.4c | 0.9–1.4a |
| P Balance(kg ha−1 yr−1) | 13.7–20.4c | 7.5–9.9ab | 5.4–7.3a | 8.0–10.9b |
| PBE (%) | 23–32c | 16–23b | 42–53 d | 9–12a |
| Output Mass (kg ha−1 yr−1) | ||||
| Milk | 3990–6290 | |||
| Animals | 187–263 | 190–266 | 102–253 | |
| Wool | 16–32 | |||
| Crops/Hay/Silage/Grain | 30–267 | 1700–2000 | ||
| TOTAL OUTPUT | 4170–6600d | 208–286b | 1700–2000c | 150–233a |
Other production constraints
Overall 63%, 87% and 89% of pasture, wheat and dairy soil samples respectively exceeded the critical values (CVs) needed for the level of production required.. Around 75% of all soil samples were classified as acidic, and because of the differences in standards used to assess Potassium (K) deficiency, 49% of soils samples used for pasture and 8% of soil samples used for wheat were classified as K deficient.
Fifty percent of pasture and 63% of wheat soil samples had Colwell P concentrations above the CV and soil pH (CaCl2) less than 5.5, indicating that more than half of the soils were not likely to be constrained by P, but potentially by acidity. Similarly, 29% and 7% of pasture and wheat soil samples had Colwell P concentrations above the CV and were likely to respond to K. For S, 61% of pasture soil samples were classified as potentially showing deficiency, whilst 28% had Colwell P concentrations exceeding the CV as well as showing S deficiency. Nineteen percent of pasture soil samples had sufficient P, but suffered from constraints due to acidity, K deficiency and S deficiency.
Weaver says this is not the first time blanket use of P fertiliers has been called into question.
“ A previous Australian audit in 2001 indicated that large areas of the agricultural zone had neutral or slightly positive P balance, and highly positive P balances where intensive agriculture was undertaken. A positive P balance is beneficial when the soil is deficient in P and good agronomic efficiency of the fertiliser offsets low PBE. In these soils, profitable rates of P result in gradual build up of P status to non-limiting values.
“It is difficult to determine how P status has changed since the last national study as the P sorption characteristics of the soils were not available. However, soils with Colwell P greater than 30 mg P/ kg (assumed to be greater than CV in many soils with PBI < 140) already occupied 40% of agricultural land area across Australia . Based on the soil sample datasets examined here, a large proportion of soil supporting sheep, beef, dairy and cropping industries in southern Australia have reached or exceeded their CV for 90–95% of maximum production (63% for pastures, 87% for wheat, 89% for dairy).
“With very few exceptions, the science for P recommendation in Australia has mostly centred on managing deficiency by using response curves, fertiliser cost and product prices to determine optimal rates which also often built-up the soil reserves. This economic approach cannot recommend a maintenance rate as its P recommendation tends to zero as a soils P status approaches its CV.
“Faced with not knowing what maintenance rate to apply to maintain the soil P status at non-limiting levels, the response in sheep, beef, dairy and cropping industries in southern Australia appears to be to follow traditional P application rates causing build-up to CVs and beyond,” he says.
Weaver says farmers should make their own decisions about rates of P required to maintain soil P status at CV, by soil testing their whole farms regularly (about every 3 years, or part of the farm each year within a 3 year cycle) to ensure that a response to P can be expected.
“Where soil testing shows P status greater than the critical value (for 95% of production) , P should probably not be applied until further testing shows that the soil P concentrations have fallen to the CV. Fertiliser P inputs only result in low build up of Colwell P in soils with low PBI due to inherently low P sorption, and subsequent higher P leaching risk than in soils with higher PBI.”
Clover pasture base inappropriate
Weaver points out the problem with current CVs for P is that they were developed as part of the Australian national Better Fertiliser Decisions project (Victorian Department of Primary Industries in 2007) for clover based pastures. While clover often forms the basis of some recommended pasture systems particularly for sheep, some high input systems such as dairies are grass dominated because of high nitrogen inputs and grazing management. Grasses and perennial pasture systems usually have lower P requirements than clover pastures and can utilise some of the water that might otherwise leach or runoff.
As well, while CVs are largely independent of yields and therefore are seasonally independent, they are dependent on soil properties that enhance root growth and access to P. In this respect there is some evidence that in cropping soils improving soil organic matter content leads to improved soil structure, root growth and lower CV of P required.
He says agronomic efficiency is close to zero in soils at and above their CVs and continued P build-up will incur financial and potential environmental costs with little yield benefits while depleting discrete non-renewable reserves of P.
“These economic and environmental considerations suggest an urgent need to improve P management in Australia and an obvious starting point is research, development and communication to enable a transition from build up to maintenance practice. The majority of cropping and dairy areas represented by 87–89% of their soil samples, and 63% of grazed pastures are in need of this transition.
“Once CVs are reached, maintenance rates of P can be based on replacing the amounts of P removed in harvested products. Hence PBEs managed at close to 100% would completely offset low agronomic efficiencies close to 0%. The data analysed in this paper suggest however that perfect offset of agronomic and balance efficiencies would not be possible in the soils examined here due to continued sorption of P into less plant-available forms and leaching and runoff losses. The maintenance rates of P should take these fluxes of P into account by adding it to the amount removed in harvested products in order to maintain the soil P status.
“At a given rate of P input, Phosphorus Balance Efficiency can be increased by lifting yields and P outputs in products. Given that 63% of pasture, 87% of wheat, 89% of dairy soil samples appear to contain Colwell P concentrations above the critical value for 90–95% of maximum production, yields are more likely to be constrained by other factors such as lack of water, soil acidity, and other nutrient deficiencies. Practices to ameliorate many of these other constraints already exist, including (i) the application of liming materials to manage soil acidity (ii) improving water holding and P retention, and reducing Colwell P/PBI of sandy soils (iii) relieving subsoil constraints to root growth to capture some leached P, and (iv) using techniques to identify site specific nutrient needs,” Weaver concludes .
Find out more
As at time of publication in 2011: David Weaver, Centre of Excellence for Ecohydrology, The University of Western Australia, Crawley, WA 6009, Australia david.weaver@agric.wa.gov.au ; M. T. F. Wong, CSIRO Land and Water, Wembley, WA 6913, Australia e-mail: mike.wong@csiro.au
The original paper “Scope to improve phosphorus (P) management and balance efficiency of crop and pasture soils with contrasting P status and buffering indices” was published in Plant Soil online 11 November 2011.
Trial confirmation
Cropping trial gives farmers insight to P balance
Farmers in Victoria’s mallee pre-empted Weaver and Wong’s review of phosphorus balance when they instigated a trial about it in 2003. At the 2012 Birchip Cropping Group’s research results seminar, consultant Harm van Rees reviewed trial progress up to the end of the 2011 season.
The long-term phosphorus trial focuses on the value of increasing rates of P on production and profitability and to determine the nutrient’s balance over an extended period of time. For the last two years it has also compared crop response predictability for soil P testing using the standard Colwell P (with PBI) against the new Diffusive-Gradient in Thin Films (DGT) test.
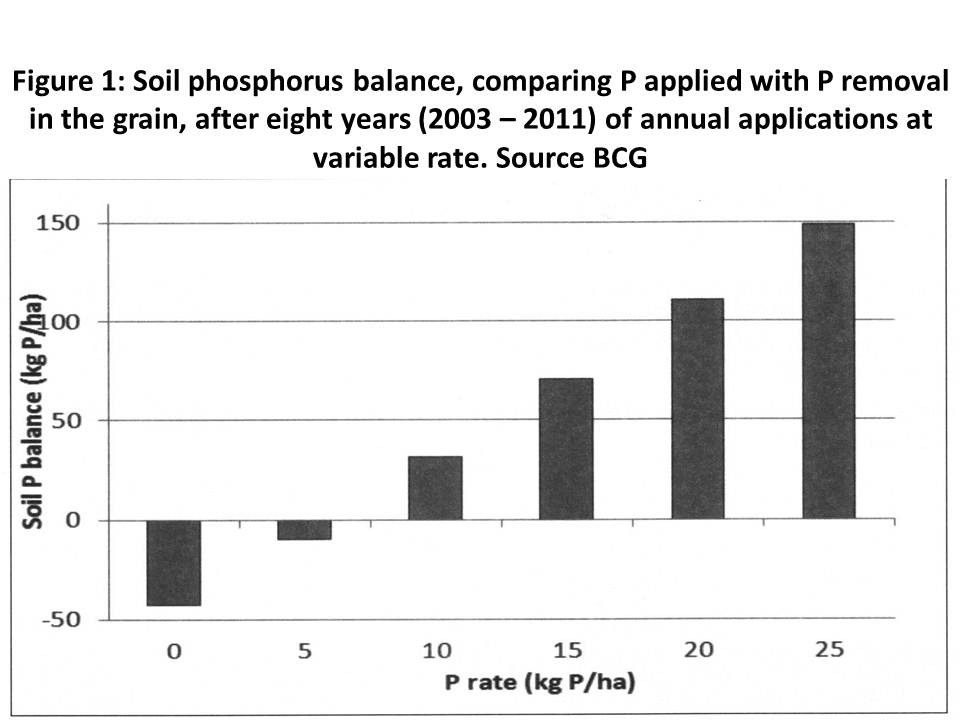
The trial involved annual P application ranging from 0 – 25 kg P/ha in 5 kg increments. The P balance after eight years of crops was closest to neutral at 5 kg/ha/yr, figure 1. The 0P balance was -45kg/ha, while the 10 kg ( P application rate?) rate was 35kg/ha.
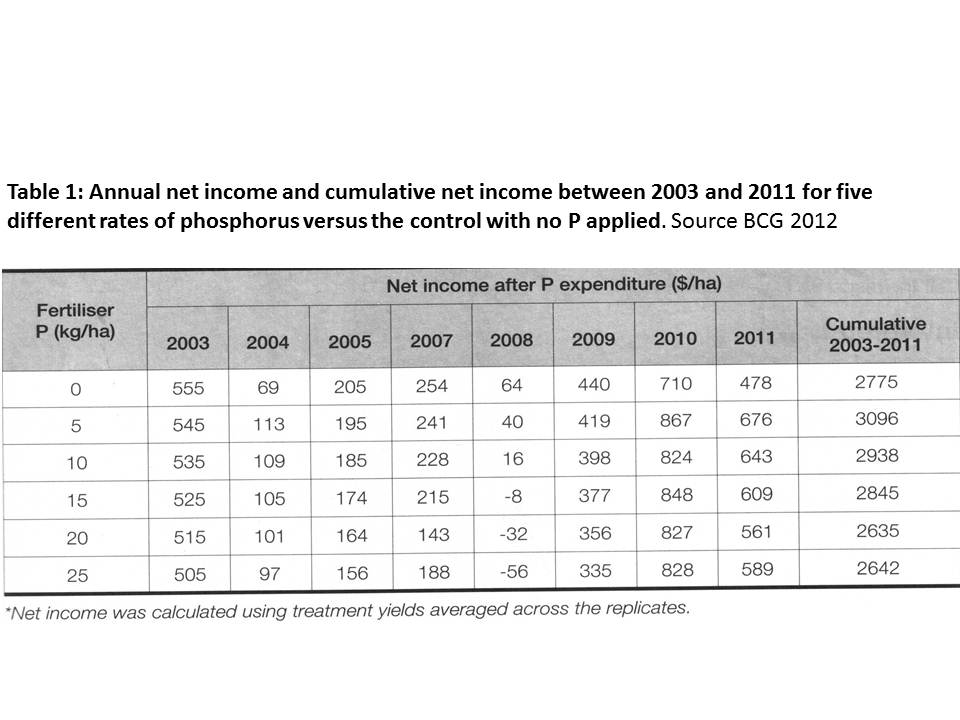
Net income on an annual basis has been calculated based on the price of grain at harvest each year and price of MAP each year. All other inputs were the same across the P treatments. The most profitable response, table 1, came from 5 kg P/ha/yr which also coincided with the most balanced application. What stands out in the net income table is that zero application is most profitable in dry growing seasons, but when soil moisture was adequate in 2010 and 2011, 5 kg P significantly improved returns. In the dry years higher P applications did not improve crop responses and net income per hectare declined.
According to van Rees farmers uncertain about the current soil P status of their paddocks, the best on-farm test is to leave a strip in the paddock where no P is applied and closely monitor crop growth and yield.
“For most soils in the southern Mallee, a Colwell P greater than 30 mg/kg is likely to be adequate for P. Applying a low rate (5 – 6kg P/ha), will allow you to capitalise on better seasons, whilst maintaining soil P reserves at minimal risk,” he said.
Based on Weaver and Wong’s Phosphorus Balance Efficiency calculation method the 5 kg P/ha/yr applied in this long term trial would have a PBE of around 100%. That is, the P applied over the years is exported in grain harvested so there is no net accumulation and minimal opportunity for it to leach or runoff. However, if stubble is burnt or cut for straw and sold off farm in high rainfall years then the P balance would need re-calculation for losses incurred.
As for the type of soil P test use, van Rees said Colwell P plus PBI is at times unreliable and the DGT soil P test looks likely to be more reliable. – Patrick Francis
Find out more:
Full trial analysis is available at www.bcg.org.au