Holbrook alternative fertilisers trial review
Correlations demonstrated between soil fertility, pasture species, carbon flows, biology and rainfall
By Patrick Francis
The Holbrook Landcare Group’s alternative fertiliser trial results contain an important message for livestock farmers everywhere. When pastures contain the right species and soil has optimum nutrition available for those species then in most circumstances regular applications of fertilisers and biological stimulants will be unnecessary. It highlights the decision making process that needs to be implemented before purchasing any commercial product which is claimed to boost productivity and or profitability per hectare or per 100 mm or rainfall.
The Holbrook trial is exceptional in that it was conducted on high fertility soils growing a balanced stand of introduced pasture species common in the area. The irony is that the farmers who initiated the trial did so it seems on the assumption that they thought some sort of fertiliser should be applied each year. Traditionally this was superphosphate, but the farmers wanted to find out if commonly promoted biological alternatives would be as useful and possibly more cost effective substitutes. The control treatment was “no fertiliser” but there is no suggestion in the Final Report that the organizing committee considered it a realistic alternative.
This demonstrates what WA agronomists Weaver and Wong uncovered from a 2010 survey of phosphorus fertiliser use across the nation’s high rainfall zones which showed on many beef cattle and sheep farms, that phosphorus fertiliser is regularly applied but its use efficiency was less than 30% so was accumulating in soils. Many farms did not need more fertiliser applied on an annual basis.
The issues associated with excess nutrients to meet pasture growth requirements is exacerbated by the low percentage of farmers who actually take regular test to find out what is in the soil. A recent Caring for Our Country report on farmers involvement in land stewardship found only 20% took soil nutrient tests in 2010 -11 and this figure was down on the previous survey. It is interesting when considering trends in soil health and potential use of alternative fertilisers that the Caring for Our Country stewardship survey does not collect data on number of farmers monitoring soil biology and any form of soil carbon.
This trial was funded as a Meat & Livestock Australia Producer Demonstration Site with additional input from the Caring for Our Country program. Holbrook Landcare Network engaged local agronomist Jeff Hirth to manage the trial and prepare reports.
The premise of this “alternative” fertilisers trial like most others for pastures in southern Australia is that the cost of superphosphate is increasing and perhaps there are “cheaper alternative products that claim to give similar pasture growth responses”. This is followed by reference to the lack of “…scientifically-valid data…” for “…local soils and pastures to support the alternatives’ marketing claims”.
Such assumptions are disappointing as they fail to acknowledge what is driving the productivity of pastures in the district in the first place. It is now well understood how a host of factors, natural, variable and management combine to produce soil health and pasture growth outcomes, let alone animal genetics and health influences on livestock productivity and the net per hectare result.
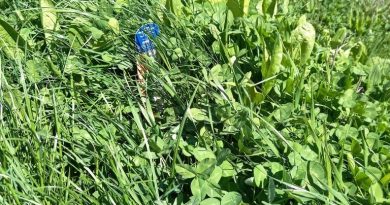
In July 2009, a replicated field trial was established on a two-year old phalaris/sub clover pasture with a soil Colwell phosphorus (P) value of 58 mg/kg, which is within the 30-100 mg/kg range of the soil test results for the properties of producer members in the Holbrook Landcare Network beef group. The site P level and soil phosphorus buffering capacity is close to optimum for pastures productivity. According to the Victorian DPI Phosphorus Buffering Index versus soil P test table, supplying additional P on this soil would not increase pasture growth.
The field trial consisted of 11 treatments, replicated four times in randomised blocks, with plots 2 m wide x 10 m long. Pasture dry matter yields were assessed regularly over the 2009, 2010 and 2011 growing seasons, which typically in the Holbrook district starts in late April and concludes in early November. Pasture composition and feed quality was also assessed in early/mid spring of each season.
After each dry matter assessment, the pasture was grazed back to approximately 1.0-1.2 t dry matter per ha (DM/ha) within 24 hours with at least 200, and sometimes 800 sheep.
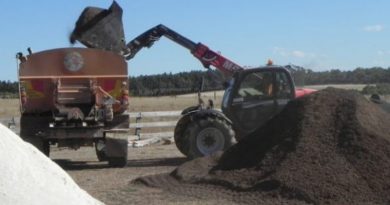
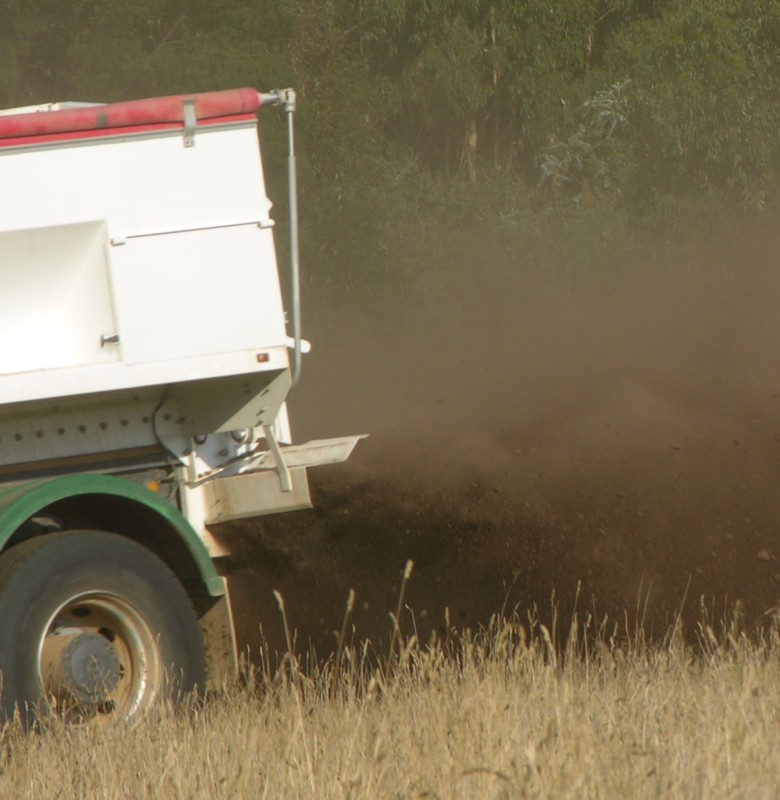
The criteria for the selection of the ‘fertiliser alternatives’ were that they were to be available locally, and to represent the range of product ‘types’ available in the market place. They should include alternative sources of nutrients, both synthetic and natural, soil microbial sources, soil microbial stimulants, and plant growth enhancers. The products were first applied on 9th July 2009, and again on 26th April 2010, 8th April 2011 and 29th February 2012. All products were applied at the rates and manner recommended by their manufacturers. Application costs for the granular and liquid products would add approximately $6/ha and $12/ha, respectively, to their per hectare purchase price.
The alternative products assessed were Bactivate, a bio-diesel by-product, CalSap, Johnson’s compost, NutriSoil LS, Prolong®, R.U.M. and TM 21. CalSap, NutriSoil, R.U.M. and TM 21 were also evaluated in the paired-paddocks comparisons; the features of each product are described in table 1.
Analysis of the products combined with application rate, table 2 demonstrates that the trial is actually not comparing apples with apples, it is comparing fertilisers with soil amieliorants (products which impact on soil structure) with soil biological stimulants (products which impact on soil microbiology) and with products that do both, in a soil which is not rated for biological activity. It is in effect comparing four widely different P and K sources and four non-nutrient biological stimulants with superphosphate. One product, Bactivate, sits in-between as it has a small P and K content as well as active biological content.
As the soil test for the site suggests no nutrient deficiencies, the committee could have taken on itself to identify possible soil food web irregularities which the biological stimulants may have been able to rectify to produce a possible beneficial impact on pasture growth. While a biological assay was undertaken it was not comprehensive enough to suggest any irregularities existed.
This is a critical issue for farmers assessing the value of applying biological products because companies marketing them always suggest they will make a positive impact on pasture growth in some way and be cost effective to use. None of these companies to my knowledge set any soil food web benchmarks at which their products will produce a cost effective response. So unlike the science of soil nutrients and plant requirements where data shows when a response is likely, biological stimulants seem to have no upper benchmarks afterwhich further increases produce no effects. It could be that the soil in this trial paddock has a satisfactory soil food web present. The pasture production results seem to confirm this is likely.
Soil biological analysis
The biological test used in this trial is a generic one for microbial enzyme activity called the Flourscein Diacetate Assay (FDA). Far more comprehensive tests of species populations and ratios can be undertaken through the Soil Foodweb International (Australia) laboratory. (This was done in the Woady Yalloak alternative fertiliser trial, but in that case paddock soil nutrition was sub-optimal.)
The 2009 versus 2012 biological results in this trial are probably its most enduring legacy because they demonstrate how complex the biological world can be. The greatest positive change in microbial enzyme activity occurred in one of the control plots, that is, by not adding anything to the soil biological activity improved, figure 1. In contrast three of the biological products produced negative impacts on microbial enzyme activity.
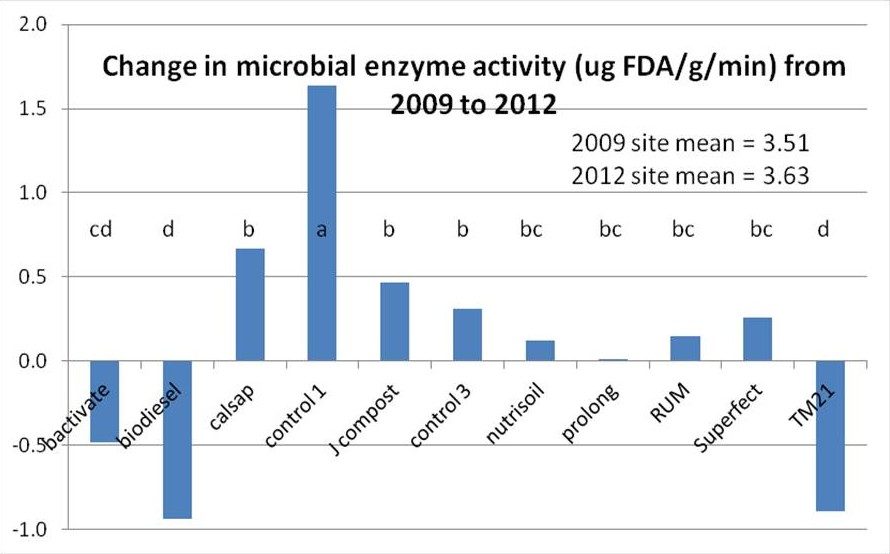
The message from this result is that farmers should ask for credible data about the circumstances under which biological stimulants produce cost effective results before they purchase any. In this trial the biological stimulants cost varied from $12.50 per ha to $153.50 per ha per year.
Another example of how complex a soil pasture biological system is was demonstrated in the result for changes in Colwell P between 2009 and 2012. As was anticipated Colwell P level lifted with the products that contained phosphorus. But it also increased in the other treatments and the controls plots. In fact control plot 1 which recorded the greatest microbial activity increase, also had the fourth largest Colwell P increase, figure 2.
The explanation is probably associated with the rainfall over the three years of the trial. Rainfall was well above average in 2010 and 2011 and average in 2012. The high rainfall boosted above and below ground carbon flows and labile stocks which stimulates biological activity, this in turn stimulates soil organic matter mineralisation and nutrient availability. As has been demonstrated on Moffitts Farm where no fertiliser has been applied since 2000, soil phosphorus levels have been maintained and are related to soil organic carbon level which in turn is related to monthly rainfall.

Given Control 1 produced reasonable available phosphorus increases as did Calsap, RUM and Bactivate which have little or no P content, table 2, the rainfall – SOC association is a likely explanation. This is reinforced by the fact that total soil P levels increased between 2009 and 2012 in virtually all the no P treatments and the two controls, figure 3.
Soil organic carbon results
This trial has generated some questions about soil organic carbon levels that are not covered in the Final Report. Firstly for a perennial pasture, the levels are not high. It raises the question about how the pasture was sown.

Two measures of carbon were taken in 2009 and repeated in 2012. The Organic C measurement is based on the Walkley-Black (W-B) laboratory method which mainly measures labile carbon, and ignores someof the non-labile carbon stocks. It is considered to measure about 80% of the total C present. The Total C measurement (using the Leco method) incorporates all the non-labile carbon (including inorganic carbon like lime) as well as the labile stocks. It subsequently can overestimate carbon present in a soil sample.
Statistical analysis of the data indicates no significant change in either measure of carbon over the three years, but both did increase. Site mean Organic C lifted from 1.86% in 2009 to 1.94% in 2012, while Total C lifted from 2.10% to 2.44%. Interestingly the 2012 Organic C level is 80% of the Total C level
The higher carbon stocks measurements supports the higher rainfall explanation surrounding increased microbiological activity and higher plant available phosphorus levels irrespective of treatment. The NSW DPI’s 2010 publication “A farmer’s guide to increasing soil organic carbon under pastures 2010” highlights the correlations when it says:
“There are no absolute levels on which to interpret SOC so it is important to monitor levels over time as SOC is an indicator of sustainability, particularly for, carbon sequestration, soil N availability, soil structure, and nutrient holding capacity.”
This statement highlights the importance of holistic knowledge when making decisions about influencing complex biological systems.
Organic C and Total C data for each treatment were not made available in the Final Report.
Pasture dry matter results
Given the high soil fertility, above average rainfall, and high perennial grass content of the site, it is not surprising there were no differences in total annual pasture dry matter yields between any of the treatments and control plots over the three years. Average dry matter yields varied each year in response to rainfall growing about 10 tonnes per ha in 2009, 13 t/ha in 2010, and 12 t/ha in 2011, figure 4.
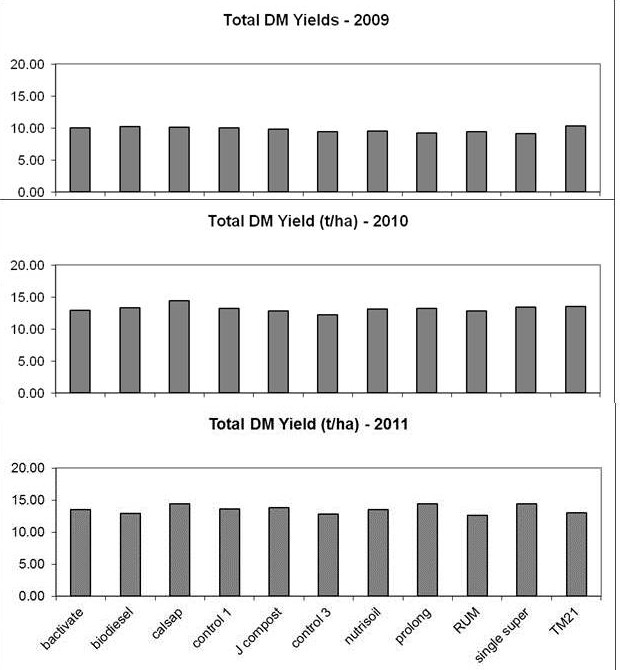
Hirth notes in the Final Report that: “the annual dry matter yields for the three seasons showed no statistical differences. This is consistent with the finding that the measures of soil fertility (available phosphorus, potassium, sulphur and nitrogen) were already adequate at the start of the trial and did not decline over the three years of the trial. As a result of the absence of any dry matter responses, both of point in time and seasonal totals, no economic analyses were undertaken to evaluate the economic returns from the use of each ‘alternative’ to single superphosphate.”
Not conducting an economic analysis for each treatment is a missed opportunity. Given most farmers routinely apply superphosphate and if they were convinced by an alternative products salesperson they might have applied in instead. An analysis would highlighted how the cost of “business as usual” can negatively impact enterprise profitability. Annual product costs varied between $12.50 per ha and $153.00 per ha. Hirth said application costs for the granular and liquid products would add approximately $6/ha and $12/ha, respectively, to their per hectare purchase price. Transport costs of products are additional but were not mentioned in the report.
The trial also included evaluations of pasture feed quality, pasture species composition and soil baulk density over the three years. None demonstrated any significant differences between treatments and the controls.
There was a paired paddocks component of this trial conducted on four district properties where sites chosen had high soil fertility. It’s aim was to evaluate selected ‘alternative’ fertilisers to provide livestock performance data in a commercial environment against the farmers’ conventional fertiliser practices. The data collected was limited to one alternative product on each farm.
The highly variable circumstances for each set of paired paddocks combined with limited and variable livestock data collection meant the results cannot be reliably evaluated. Firth went a little further and concluded that the limited data from the paired paddocks showed “…the effects of ‘alternatives’ on live weight changes were negligible and inconsistent.”
Take home message
This trial is a classic demonstration of the importance of understanding how biological systems work, rather than cherry picking components for a quick fix or silver bullet advantage. For three years, not applying fertiliser or biological stimulant and not incurring their cost produced pasture productivity that no other treatment could better.
Previous sound management to ensure soil fertility was high combined with a strong perennial grass pasture provided a reasonable level of soil organic carbon. Good rainfall over the trial years ensured plenty of labile carbon was generated which in turn stimulated biological activity, this in turn boosted nutrient availability to optimum level for plants.
This trial site could continue to provide useful information if dry matter yields and soil microbiological and nutrient levels are monitored without further additions of products. On this site management strategies that enhance above and below ground carbon flows and subsequently build labile stocks in association with rainfall variability are likely to produce some rewarding information for future decision making about inputs.
Footnote:
A range of questions about this trial were submitted by Patrick Francis. Answers were received for most questions, they are shown in bold. The questions were:
* Do you have any data about the history of the trial site paddock for the last five or even better 10 years. Am interested in the annual fertiliser program, lime applications and stocking rates?
Average annual P application in the eight years preceding the trail was 15 kgP/ha. If beef cattle were run on the paddock at
around 15 dse/ha and 400kg of live weight per ha were grown on the paddock annual P export in liveweight would be
approximately 3 kg P per ha year. The trial paddock has been receiving far more P input per year than is exported off it in liveweight. The paddock also received 2.5t/ha of lime in 2002. The fertiliser history indicates suggest available soil P should be adequate given a moderate level of biological activity is taking place. At the 2009 measured available soil P level (Colwell 58 mg/kg) and phosphate buffering index (36-70) pasture production is not limited by P so no additional P is required.
* The trial site pasture was sown in 2007 with phalaris etc, what technique was used to sow it – direct drill or cultivation and sowing into a prepared seedbed?
The paddock was direct drilled with Holdfast and Australian phalaris in 2004.
* Two soil carbon tests are reported – Organic C which I assume is the Walkley Black test; and the Total C which I assume is the Leco test. What was the reason behind taking the two different tests? W-B is generally assumed to measure about 80% of total C.
No answer to this question.
* Do you have any other Organic C or Total C measurements from pasture soils in the district or even some data from unfarmed roadsides? Total C seems low for a perennial pasture unless it is a sandy soil. What is the soil type for the trial site?
Site is a granite based clay loam, traditionally perceived as responsive to fertiliser. Comparative benchmark soil carbon data from non-farmed site is not available to the Landcare Network. However, a collection of organic carbon tests on farmed soils in the Holbrook district in 2011 has figures ranging between 1 and 3%, and the average being 2%. So the trail site in 2009 with 1.86% Organic Carbon was typical of a farming site in the district.
* How did Organic C and Total C vary for the different treatments – Table 3 only provides averages?
Data provided shows Total Carbon has uniformerly increased across all treatments and controls by an average of 0.33% over the three years. The key point here is that the control increased just as much as any of the treatments. It makes a connection to rainfall effect. The rise in Total Carbon suggests an increase in the non-labile or humus fraction compared with labile fraction which is measured by Organic Carbon which on average increased by 0.08%. However statistical analysis shows these increases were not significantly different over the three years.
* Table 1 and 2 refer to “soluble” nutrients in applied products, why wasn’t total nutrient contents compared as well?
Jeff Hirth says the farmers were particularly interested in the N content of the liquid alternatives and believe their ‘soluble’ contents were a good equivalent measure of their total nutrient contents.
* Soil biology analysis was based on the FDA. Did you consider a Soil Foodweb Institute analysis of soil microbiology which gives a far more comprehensive insight to species present and ratios? Do you know what an acceptable FDA figure is for the soil type the trial was conducted on, and what sort of variation can be expected throughout the year as microorganisms populations vary due to climatic conditions?
Jeff Hirth says tight funding meant he couldn’t measure other soil microbial properties of the likes that Pat Francis and others have suggested. And with the FDA data, Jeff asked a soil microbiologist (Pauline Mele) and the technician (Josh Rust) who does these analyses, the very same questions, without success.
* Can you tell me what the feedstock source for Johnson’s compost is? Compared to animal manure composts it seems to have a very low nutrient content. Given the relative proximity of feedlot composts west of Holbrook I am surprised such a recognised alternative soil health product wasn’t used for the trial? The product also seems very expensive. Is the $150/t quoted a DM or ‘as is’ price? I can source composted feedlot manure made by Rivcow at Charlton feedlot for $60 per tonne ($85/t DM) delivered 200 km to Romsey. Spreading costs a further $25 per tonne.
The reasoning behind using Johnson’s Billabong Compost was not forthcoming. Further information provided about the compost is that is based on plant matter with around 5% animal manures.
* Were any dry matter yield measurements taken in 2012 and if so are they available?
Jeff Hirth says plant data were measured for the 2009-2011 seasons, and apart from the final soil sampling in 2012, no other field work was undertaken in 2012.
Table 1: The Holbrook Landcare Network alternative ‘fertiliser’ treatments
Control – no fertiliser applied.
Single superphosphate (8.8 per cent P, 11 per cent S) applied annually at 0.6 kg P/DSE or 10.8 kg P/ha or 123 kg/ha of single superphosphate at a product cost of $50.36/ha in 2009.
Bactivate a microbial soil conditioner claimed to consist of living, beneficial microorganisms that incorporate ‘valuable life’ into the soil and enhance plant growth. Other claims included:
* a complete fertiliser/soil rebuilder, which provides essential nutrients to build the soil’s structure
* stimulated the development of soil biological activity, increase phosphorus uptake by plants, make atmospheric nitrogen available and readily-accessible to roots
* promoted the growth of roots by releasing plant-regulating substances, protected the roots from pathogenic microorganisms
* provided a healthy environment for outstanding plant growth and performance
In 2009, it was applied at 150 kg/ha at a product cost of $264.00/ha with 150 kg/ha of blood and bone to ‘feed’ the bacteria. In 2010, this product was reformulated as Bactivate Plus and applied at 75 kg/ha, together with a commercial source of humic acids (Monty’s Liquid Carbon) at 2 L/ha, at a combined products cost of $153.50/ha.
Biodiesel by-product, a high potassium and sulphur powder derived from the production of tallow bio-diesel near Albury-Wodonga. This product was being applied as a potassium source to pastures on coastal sandy soils in southern Victoria and is not yet commercially available. It was applied annually in the trial at 100 kg/ha.
CalSap is a liquid containing soluble calcium that is claimed to be up to 340 times more soluble than the calcium in lime-based products and therefore more effective in maintaining calcium in the soil solution. It is claimed to:
* be suitable for most soils
* help displace sodium in sodic soils
* neutralise soil acids in the root zone, remediate soil pH, with many commensurate benefits on plant growth and vigour
It was applied at 20 L/ha annually at a product cost of $87.00/ha.
NutriSoil LS is claimed to be a concentrated, high-nutrient, broad-spectrum liquid plant food produced from a unique earthworm composting system. Nutrient sources can include organic animal, plant and marine materials, crushed minerals, seaweed, fish meal, dolomitic lime, rock phosphate and humic acids that compost earthworms and other soil organisms convert to plant-available forms. Claimed benefits include:
- ‘instant’ uptake of the full range of trace elements and minerals by plants
- reduced need for pesticides
- existing soil nutrients ‘unlocked’
- stronger and healthier plant root systems
- increased ‘soil life’, all of which result in increased plant yields
It is applied at 5L/ha after the autumn break and again in spring to actively-growing plants (annual cost of product = $53.30/ha). An accumulative effect with repeated applications is claimed.
Prolong®, a biologically-activated rock phosphate fertiliser produced by Incitec Pivot Ltd. Rock phosphate is inoculated with a cultured fungus that produces organic acids to slowly solubilise the rock. Natural carbon sources and hydrolysed fish waste are added to provide energy and protein (nitrogen) for the fungus. It is claimed to provide plant-available phosphorus progressively over time at rates consistent with plant needs. While primarily a phosphorus fertiliser, it also contributes significant amounts of calcium, as well as trace amounts of other nutrients in organic forms provided in the fish waste.
As the manufacturer was unable to provide a recommended application rate, and given suggestions it only need to be applied every third or fourth year, it was applied at four times the rate of single superphosphate (i.e. 491 kg/ha) at a product cost of $171.10/ha in the first year. It will only be applied every fourth year.
R.U.M, a liquid plant food, claimed to be rich in natural nitrogen and nitrogen-fixing bacteria, with high populations of bacteria (190,000 colony-forming units/ml) plus readily-available liquid minerals and trace elements. Claimed benefits include:
- immediate absorption of dissolved major and trace nutrients by plants
- ‘kick-start’ soil microbial activity to more rapidly break down organic matter for increased plant growth
It was applied annually at 5 L/ha at a product cost of $25.00/ha.
TM 21 is described as a bio-stimulant that feeds and increases the populations of beneficial microorganisms in soil. It claimed benefits include:
*improved N and P cycling efficiency
* increased organic matter and soil carbon contents
* reduced plant diseases and insect problems because of healthier plants and thicker cell walls
It was applied annually at 250 ml/ha (product cost = $12.50/ha) in the autumn in a manner that ensured good soil contact.
In 2010, Johnson’s Compost was included as an additional treatment and applied to the ‘Control 2’ treatment plots, at a rate of 1000 kg/ha at a product cost of $150/ha and an application cost of $30/ha. It was applied on 19th August 2010 and again on 4th April 2011. Johnson’s compost is manufactured locally at Little Billabong Station near Holbrook.
Table 2. The application rates of the applied products and the amounts (kg/ha) of soluble nitrogen (N) as ammonium-N and nitrate-N, phosphorus (P) and potassium (K) applied in the products to the plots.
Product Product Ammonium-N Nitrate-N Soluble P Soluble K
application
rate (kg/ha) (kg/ha) (kg/ha) (kg/ha)
Particulates (kg/ha)
Bactivate 150 0.2 0.0 1.7 0.4
Blood & bone A 150 0.1 0.0 7.4 1.4
Biodiesel by-product 100 0.0 0.0 0.1 35.2
Johnson’s compost B 1000 0.0 0.4 0.4 3.1
Prolong 490 C 0.1 0.0 64.2 1.2
Superphosphate 123 0.0 0.0 10.8 0.0
Liquids (L/ha)
CalSap 20 0.0 0.0 0.0 3.5
NutriSoil LS 5 D 0.0 0.0 0.0 0.0
R.U.M. 5 0.1 0.0 0.0 0.0
TM 21 0.25 0.0 0.0 0.0 0.0
A Applied in 2009 only; B Applied in 2010 & 2011; C Applied every fourth year; D Applied twice annually.