Basin Plan degradation claims undermine landcare farming and investment
By Patrick Francis
One of the inconsistencies often found in the federal government’s policy development associated with agriculture, food processing and environment is contradictory arguments involved in justifying the recommended direction. In the final version of the Murray-Darling Basin Plan part of the justification for the legislation is to prevent” … ongoing and increasing degradation of water-dependent ecosystems in the Basin.” And that “Basin ecosystems are likely to have reduced resilience to drought and climate change.”

Specifically, Section 9.02 of the final Basin Plan refers to water quality degradation in terms of :
(a) elevated levels of salinity;
(b) elevated levels of suspended matter;
(c) elevated levels of nutrients, including phosphorous and nitrogen;
(d) elevated cyanobacteria cell counts or biovolume, toxins and odour compounds;
(e) water temperature outside natural ranges;
(f) dissolved oxygen outside natural ranges;
(g) elevated levels of pesticides, heavy metals and other toxic contaminants;
The Murray Darling Basin Authority relies on CSIRO and national and state “State of environment” reports for its environmental assessement of the Basin’s 23 river systems, figure 1. It concludes “CSIRO found that the ecological condition across the regions of the Basin is predominantly poor, with the trend being one of decline.”
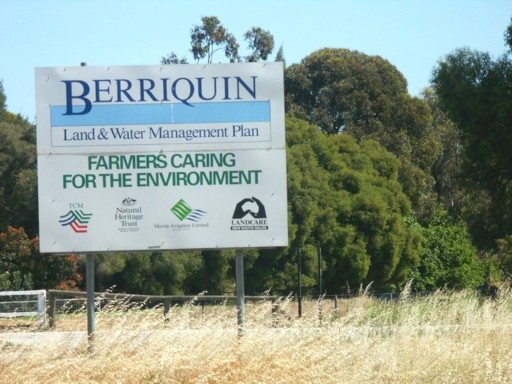
Farmers in the Basin could be forgiven for being a little puzzled, if not insulted by such justification and the prominent use of data in figure 1 as most are also involved with landcare through Caring for Our Country, catchment management authorities (CMAs), and a host of programs associated climate change adaptation. Their participation in all these programs is not new, Caring for Our Country and its predecessor the National Landcare Program has been operating since 1990 and been funded to the tune of approximately $6 billion so far. A new tranche of funding, $946 million in the Biodiversity Fund, was recently announced associated with the Carbon Farming Initiative.

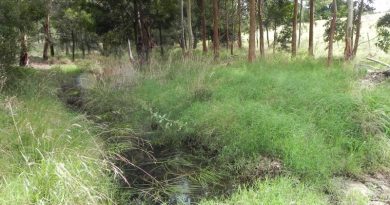
The trends provided for birds, wetlands and vegetation in figure 1 and in the list of water quality degradation factors do not stack up with landcare practice. While the programs funded for NLP and Caring for Our Country have not been analysed critically, most farming projects administered by landcare groups and CMAs have focused on improving environmental indicators along water courses. One measure of many projects effectiveness is the kilometres of riparian area fenced off and revegetated, including wetland and floodplains. Another is the rehabilitation of iconic bird or animals species. As well as a requirement for improving biodiversity another key criteria for funding projects has been their association with climate change mitigation or adaptation.
Given that high proportion of landcare groups and CMAs are situated in the Murray-Darling Basin then the Plan’s contention that “ongoing and increasing degradation” is happening suggest the millions of dollars and untold number of farmer voluntary labour hours spent on riparian programs and climate change adaptation so far has been fruitless. As well, an enormous amount of money and voluntary work has been spent on public land riparian areas environmental reclamation since landcare began in 1990. Frankly, such an assessment of environmental conditions in the river catchments by the Authority is unbelievable.
Artificial biodiversity
Another surprising omission from the Plan’s coverage of the Basin’s environmental condition is failure to recognise the biodiversity impact of artificial water bodies along the rivers, both those owned by the Authority (locks) and others developed on farms. This is particularly significant as much of the western section of the Basin in its natural state would have little stored water, especially in below average rainfall and drought years. The irony of this omission is that justification for much of the water removed from irrigation is to supply water to wetlands and flows in some streams during dry year to help maintain biodiversity. This is despite the fact that most wetland birds are transitory, maintaining a presence on any permanent water body. But when enough rain falls to flood ephemeral wetlands they migrate to them for mass breeding.
In attempting to control natural events such as water bird breeding, the Plan is contradictory. There is too much artificial control of water flow in the southern Basin but laments the lack of water control in the northern Basin to allow manipulation of biodiversity.
“In the northern Basin, there is greater variation in outcomes, owing to differences in water management arrangements, and greater challenges in delivering targeted environmental water due to the unregulated nature of the rivers.”
One explanation for the Authority’s constant reference to negative catchment environmental health and subsequent justification for the Basin Plan is its reliance on models or guesses of what it might have been like prior to European settlement. The Authority uses the report “Snapshot of the Murray-Darling Basin River Conditions” published by CSIRO in 2001 as a benchmark reference for water quality and environmental targets. In assessing river condition in the Basin, the report has adopted what it calls the “reference condition approach”.
Pre-European benchmarks
“That is an assessment of condition relative to what the rivers should have been like if they hadn’t been changed. Most …environmental factors were assessed against a pre-European development benchmark based primarily on modelled data.” The reference conditions used for the Assessment of River Condition (ARC) components are shown in Table 1 from the report.

Such a comparison is so speculative it is almost meaningless. Typical examples from Schedule 1 of the Basin Plan are:
- It is estimated that the fish communities in the Basin are at about 10 per cent of their levels before European settlement.
- However, assessments indicate that about 90 per cent of the Gwydir Wetlands, 75 per cent of the wetlands of the Lower Murrumbidgee floodplain, and 40–50 per cent of the Macquarie Marshes have been lost since European settlement.
- The breeding of colonially nesting waterbirds in the Barmah-Millewa Forest on the Murray, the number of waterbirds and waterbird nests, and the frequency of waterbird breeding in the Macquarie Marshes have been reduced relative to without-development conditions.
In its “Sustainable River Audit 2” report the Authority contends that Reference conditions estimates of the 23 designated valleys of the Basin are “… not used as a target for management but is a benchmark representing the river ecosystem in a definitive state of good health”. This is hard to believe because the Basin Plan uses Figure 1 trends as part of its justification for setting a long-term environmentally sustainable level of take of water from the Basin’s rivers.
The danger in using such speculative reference conditions is that farmers will become accountable to target values associated with them. Some targets will be impossible to reach as return to pre-1750 environmental conditions is impossible. The CSIRO report recognises this with its overall environment index assessement stating that “69% of (Basin) reaches have been moderately modified and 29% substantially modified”. This overall result shows the extent of change brought about by human use of the river basins.”
Despite the modifications to the Basin the CSIRO report is highly speculative in places. For some environmental indexes there is so little data available that any assessment is meaningless. Examples are the biota index and hydrological disturbance index.
Guessing trends
The CSIRO report makes some bizarre environmental condition assessments when reporting on the seven zones along the actual Murray and Darling rivers. For each zone it compares a range of biotic and environmental features for their current (pre 2001) condition and the trends taking place. Despite having no condition data for some features, the writers still make a trend guess. Figure 2 demonstrates this approach in Zone 3. Despite having no assessment for condition of nutrient concentration and in-stream salinity, the report says the trend for the former is improving and for the later is degrading.

These assessments also highlight how little notice has been taken about outcomes from the National Landcare Program and Caring for Our Country. Assessments for riverine habitat, bank condition and catchment impacts on river should be known along the Murray given the millions of dollars spent on landcare programs, but this report indicates no assessments have been made or no trends are available in any of the zones. That was possibly the case pre 2001 when the report was written, but is not the case in 2012 when the final Plan was published.
There has been little attempt to quantify or recognise contemporary vegetation and biodiversity trends throughout the Basin, which have developed in conjunction with agriculture. Some ecologist refer to the ‘increaser species” those that are favoured by development and “decreaser” species, those that decline as a result of it. Various forms of agriculture produce new environmental balances and changes to ecosystems services, but they are not inherently negative, with the right management practiced, just different. Most importantly these farm based ecosystem services have the added advantage of producing food and creating wealth for the communities involved.
Despite it negative assessment of most of the 23 valleys in the Basin the Authority points out in “Sustainable Rivers Audit 2” that the Plan will not address catchment issues “…associated with productive land use, influence of invasive species, habitat alteration”.
It says these issues have contributed to the observed decline in the health of the Basin’s rivers wetlands and floodplains, but they are someone elses problem to solve.
“The Basin Plan is not a standalone plan to address river health; and many other complementary river and catchment management activities will still be required.”
The Authority has some reports which suggest environmental conditions are not as bad as some scientists and lobbyists suggest, but chooses not to highlight them in the Plan. For instance a review of water invertebrates conducted in 2010 and again in 2011 at a number of sites demonstrates excellent species diversity and numbers. Invertebrate diversity in water bodies is an excellent indicator of water quality, the greater the diversity the better the quality.
Similarly the Report of the Independent Audit Group for Salinity 2010 -11 which reviews current salt interception programs says “.. for the second year in a row the Basin target has been reached.” This result shown in figure 3, is important as the latest assessment period was a flood year, while the preceeding year was one of low flow due to drought.

In devising the Basin Plan the Authority funded hundreds or reviews and reports. There is one which seem critically important to understanding the highly variable nature of the Basin’s ecology which isn’t mentioned in the final document. Of all the reports it suggests how futile setting unrealistic water quality and environmental targets can be in the Basin.
“Droughts in the Murray Darling Basin since European settlement” by Griffith University’s Dr Peter Helman is a standout document. His conclusion about learning from history cast some doubt about the scientific approach underpinning the final Basin Plan.
“Ignoring history leads to analysis of short term records which do not include long term (multi-decadal) osciallations. Making projections from short term data without considering long term variability may be invalid. Uncertain science is not a satisfactory basis for sustainable natural resource decision making. History does not lend to teaching unless we can understand how the process of climate, ecology, management and policy interact. The problem is that climate and ecology operate over different time scales from management and political decisions. Unfortunately, the two centuries of European management of Australian landscapes is littered with failures to grasp the reality that sustainable management needs to consider a critical climate feature – extended drought periods with severe droughts recurring over decades,” he said.
POSTSCRIPT
Snouts in the Basin Plan trough beginning to appear
An inevitable outcome of the Basin Plan’s water and environmental quality targets is millions of dollars will be spent annually on collecting data and trying to make some sense of a continuous change in a highly variable biological system. And the research institutions are already lining up for funding to do the work.
A recent conference in Canberra brought together 100 water managers and scientist “… to develop a vision of how we better measure outcomes from water initiatives across Australia.”
The Basin Plan contains an estimate of what it will cost taxpayers to monitor water and environmental quality in selected catchments.
“Implementation of the Basin Plan will result in changes to administrative costs for the Basin States and the Commonwealth. In particular, these costs will be associated with increased requirements for water resource planning, environmental watering, water quality and salinity management, water trading, and monitoring and evaluation. The Authority has estimated the net additional administrative costs for the Basin States and Commonwealth for the implementation of the Basin Plan to be on the order of $100 million per year.”
This estimate is likely to be just the tip of the iceberg as catchment authorities are challenged to produce quality outcomes that mimic targets based on modelled estimates from pre-1750. As well water quality target data must be constantly fed to the Authority as it must “… conduct a review of the water quality targets in the water quality and salinity management plan every 5 years after the commencement of the Basin Plan”.
At the conference Associate Professor Michael Stewardson from the University of Melbourne School of Engineering said a coordinated effort across government agencies and with the private sector was needed to monitor impacts of the Basin Plan in terms of environmental, social and economic outcomes. There is no mention of the cost involved in working to change management on irrigation and dryland farms to achieve required outcomes.
“This is a complex task requiring innovation in the way we gather, integrate and share information on the water system along with the goods and services it provides,” he said. New and sustained partnerships between the water industry and research and development sectors are needed to develop the necessary data infrastructure
“It isn’t enough to take lots of measurements and prepare reports on how we are tracking in delivering on Basin Plan targets. We need to get this intelligence to the people who are making decisions. This includes decisions made by irrigation farmers and environmental water managers.”
There is a peculiar section in the new Plan (section 9.11) which demonstrates some of the futility involved, it suggests water quality targets are voluntary and if not met it doesn’t matter:
“The failure to achieve a target does not in itself mean that:
(a) a person has acted inconsistently with the water quality and salinity management plan; or
(b) a person is required to take particular action or refrain from taking particular action in response to the failure.”
Further on in section 9.13 about guidelines there is another amazing statement:
(1) The Authority may publish guidelines relating to the application of the targets set out in this Part, for example, recommending actions to be taken by relevant persons and bodies in order to achieve the targets or in the event that a target is not met.
(2) To avoid doubt, nothing in the Basin Plan binds any person or body to comply with the guidelines.

There is an alternative to this top down approach to catchment targets and that is to reward irrigation farmers for the on-farm improvements made to water use efficiency, water quality and environmental outcomes. As the indicators for these characteristics are already known, this is likely to produce far more positive effects for the Basin and for far less outlay than catchment monitoring by hundreds of scientists and researchers chasing highly speculative pre-1750 indicator targets in a highly variable rainfall Basin which don’t have to be met anyway. Some irrigation farmers growing rice, cotton, wine grapes and vegetable have been working towards improved outcomes for years through their voluntary environment management programs.