Impact of US corn on grain price
Despite US drought world corn production is second highest on record
By Patrick Francis
The claims regularly made by politicians and industry lobbyists about Australia’s role in world food production particularly into Asia need to be tempered by the reality of world grain markets and the potential for farmers in major exporting countries to respond to price signals.
Two aspects of world food production not taken into account by casual observers are that the most traded grains are corn and soybeans, and meats growing most in demand are poultry and pork. In contrast, Australian farmers’ two highest volume and value commodities are beef and wheat of which about 60% is exported. In real terms prices of both these commodities and food prices in general across the world have, according to an International Monetary Fund (IMF) researcher, “been on a pronounced downward trend for several decades and are still about 50% below their average level of the 1970’s despite increases in the last 12 months, figure 1.

Data supplied by the U.S. Grains Council in early November shows world corn production of 839 million metric tons for the 2012/2013 marketing year will be the second highest on record, down 37 million tons from 2011/2012 but up 8.2 million tons from 2010/2011, according to the U.S. Department of Agriculture.
The 44.8 million tons decline in U.S. corn production over the past three years is mostly offset by production growth in Ukraine, Argentina and Brazil, figure 2. The global stocks to use ratio fell to 13.7 percent, its lowest level in nearly 15 years.

US Grains Council says corn exports and export market share have declined over the past several years due to reduced U.S. supplies, high prices that encourage global production, and increased competition in export markets.
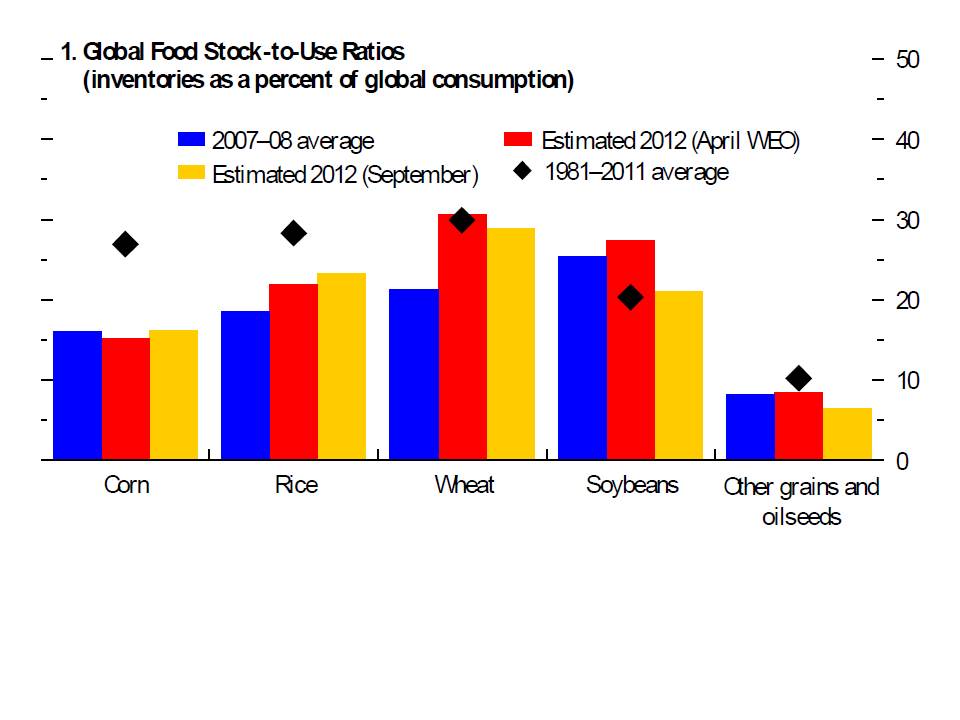
In contrast the IMF reports global wheat and rice stock-to-use ratio “ …have improved significantly…” since 2007-08, figure 3.
USDA Chief Economist Joe Glauber told the November Export Exchange 2012 conference that the U.S. production losses in 2012 are largely offset by increases elsewhere in the world, and that crop insurance leaves most U.S. producers in a strong position to rebound next year. The United States was on track to an all-time record corn harvest in 2012, before the drought intervened.
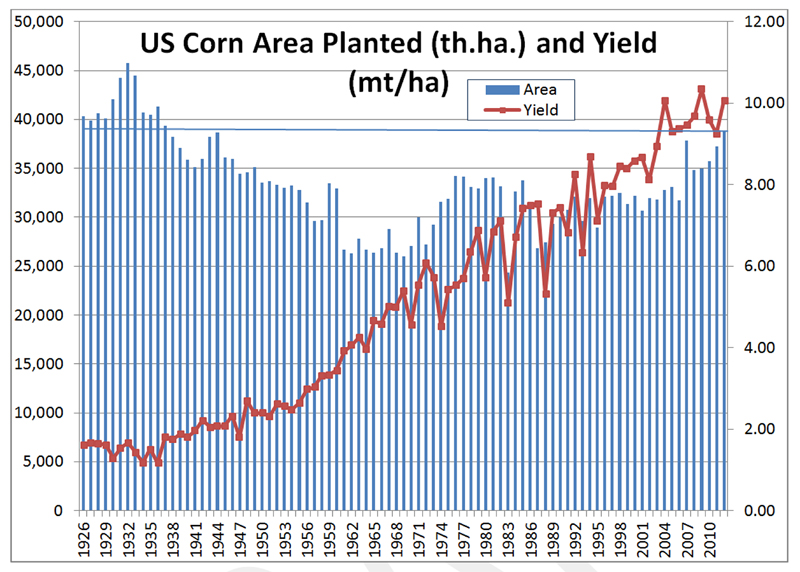
The US area planted to corn in 2012 was the second highest on record, close to the area sown in the 1930’s. The difference between now and then is that corn yields are five times higher, 10t/ha vs 2t/ha, figure 4.
Given the growth in corn production in other countries, figure 2, then a major oversupply would have eventuated having a negative impact on world grain prices, particularly wheat in Australia. It is interesting to note that the decline in US corn production over the last three years is a tonnage in excess of Australia’s total annual grain production in a non-drought affected year.
Australia’s grain farmers will be keenly watching US farmers plans for corn in 2013. When grain prices are above average more hectares are planted. Unless another significant weather event happens in a major corn producing country 2013 is likely to be a record corn year. According to the IMF’s World Economic Outlook in October futures markets suggest significant downward movement in corn and soybean prices over the next two years. The impact on wheat price, while negative, is not predicted to be as great, figure 5.